Обсуждение: Lock timeouts and unusual spikes in replication lag with logical parallel transaction streaming
Hi all,
In testing out the subscription parameter "streaming" we've noticed some unusual spikes in replay_lsn lag (and also confirmed_flush_lsn lag) when using "streaming = parallel".
During the periods of unusual lag (when compared to a separate "streaming = off" subscriber) we also see some additional logging from the (replica) postgres server about waiting for / acquiring locks, as well as error messages about logical apply workers exiting.
Then, today we found the logical replica stuck with a lag of about 30GB. The logs revealed a looping lock timeout with the parallel apply workers, the relevant section of which is attached.
While these workers were stuck, we queried the pg_locks catalog table in an attempt to collect more information. The query itself, and the resulting data (run with "\watch 1") are attached.
What I see in the output is that the lead apply worker (pid 2857187) is blocking the parallel worker (pid 2857523), then later another parallel worker (pid 2861846) is also blocking the lead apply worker (pid 2857187).
What I can't see, is anything blocking pid 2861846, and the logs don't show much about this worker (only that it starts and then is terminated). It's not clear to me whether this is a deadlock, or a case where we need to increase the lock_timeout (we didn't try).
At this point, I don't have a description of the upstream load that leads to this issue, and I don't have a reproducer script
One thing I should mention is that the schema of the publisher and subscriber are completely identical; the subscriber was created using pg_createsubscriber, and has not had any DDL applied (except for temp tables) since. I know that there is a risk of deadlocks in the case of schema differences, but there certainly isn't an extra index, constraint, or anything like that on the subscriber.
Given the poor performance and issues we are having with the "streaming = parallel" option, we will likely be sticking with the "streaming = on" option, which successfully worked to reduce our logical replication lag.
I noticed that the "parallel" option is slated to become the default for new subscriptions in PostgreSQL 18, and I wonder whether this is wise, given the potential for locking issues; in our replication cluster, several distinct scheduled jobs lead to the parallel streaming logical replication falling far behind the non-streaming version.
PostgreSQL version and some relevant configuration information:
version
----------------------------------------------------------------------------------------------------------
PostgreSQL 17.4 on x86_64-pc-linux-gnu, compiled by gcc (GCC) 11.5.0 20240719 (Red Hat 11.5.0-5), 64-bit
shared_buffers work_mem max_worker_processes max_logical_replication_workers max_parallel_apply_workers_per_subscription Thanks,
----------------
98172MB
----------
6GB
----------------------
36
---------------------------------
8
---------------------------------------------
8
Zane
Вложения
On Mon, Aug 11, 2025 at 11:51 AM Zane Duffield <duffieldzane@gmail.com> wrote:
>
> In testing out the subscription parameter "streaming" we've noticed some unusual spikes in replay_lsn lag (and also
confirmed_flush_lsnlag) when using "streaming = parallel".
> During the periods of unusual lag (when compared to a separate "streaming = off" subscriber) we also see some
additionallogging from the (replica) postgres server about waiting for / acquiring locks, as well as error messages
aboutlogical apply workers exiting.
>
> Then, today we found the logical replica stuck with a lag of about 30GB. The logs revealed a looping lock timeout
withthe parallel apply workers, the relevant section of which is attached.
>
> While these workers were stuck, we queried the pg_locks catalog table in an attempt to collect more information. The
queryitself, and the resulting data (run with "\watch 1") are attached.
>
> What I see in the output is that the lead apply worker (pid 2857187) is blocking the parallel worker (pid 2857523),
thenlater another parallel worker (pid 2861846) is also blocking the lead apply worker (pid 2857187).
> What I can't see, is anything blocking pid 2861846, and the logs don't show much about this worker (only that it
startsand then is terminated). It's not clear to me whether this is a deadlock, or a case where we need to increase the
lock_timeout(we didn't try).
>

It is not the case of deadlock. Increasing lock_timeout could only
help if the parallel worker (2861846) is slow but still processing the
changes but if it is stuck in some other wait like LWLock then it
won't help. The key part of the puzzle is what exactly the process
2861846 is busy with? You can either share more server LOGs for that
or it would be better to increase the LOG level to DEBUG-1/2 to see if
we can get some more information about process 2861846.

The other wait you see for worker 2857523 is normal as it is waiting
for the next set of changes from the leader worker after processing
its current set.

> At this point, I don't have a description of the upstream load that leads to this issue, and I don't have a
reproducerscript
>

Please see, if you can get that because the current set of information
is not sufficient to establish that it is the problem of parallel
apply.

> One thing I should mention is that the schema of the publisher and subscriber are completely identical; the
subscriberwas created using pg_createsubscriber, and has not had any DDL applied (except for temp tables) since. I know
thatthere is a risk of deadlocks in the case of schema differences, but there certainly isn't an extra index,
constraint,or anything like that on the subscriber.
>
> Given the poor performance and issues we are having with the "streaming = parallel" option, we will likely be
stickingwith the "streaming = on" option, which successfully worked to reduce our logical replication lag.
> I noticed that the "parallel" option is slated to become the default for new subscriptions in PostgreSQL 18, and I
wonderwhether this is wise, given the potential for locking issues; in our replication cluster, several distinct
scheduledjobs lead to the parallel streaming logical replication falling far behind the non-streaming version.
>

It is worth considering but we should at least first figure out what
is going wrong. It could be some minor bug either in parallel-apply
infrastructure or a pre-existing one which is exposed due to
parallel-apply activity.

--
With Regards,
Amit Kapila.
RE: Lock timeouts and unusual spikes in replication lag with logical parallel transaction streaming
On Monday, August 11, 2025 2:21 PM Zane Duffield <duffieldzane@gmail.com>  wrote:

> Hi all,
>
> In testing out the subscription parameter "streaming" we've noticed some
> unusual spikes in replay_lsn lag (and also confirmed_flush_lsn lag) when using
> "streaming = parallel".
>
> During the periods of unusual lag (when compared to a separate "streaming =
> off" subscriber) we also see some additional logging from the (replica)
> postgres server about waiting for / acquiring locks, as well as error messages
> about logical apply workers exiting.
>
> Then, today we found the logical replica stuck with a lag of about 30GB. The
> logs revealed a looping lock timeout with the parallel apply workers, the
> relevant section of which is attached.
>
> While these workers were stuck, we queried the pg_locks catalog table in an
> attempt to collect more information. The query itself, and the resulting data
> (run with "\watch 1") are attached.
>
> What I see in the output is that the lead apply worker (pid 2857187) is
> blocking the parallel worker (pid 2857523), then later another parallel worker
> (pid
> 2861846) is also blocking the lead apply worker (pid 2857187).
>
> What I can't see, is anything blocking pid 2861846, and the logs don't show
> much about this worker (only that it starts and then is terminated). It's not
> clear to me whether this is a deadlock, or a case where we need to increase
> the lock_timeout (we didn't try).
>
> At this point, I don't have a description of the upstream load that leads to
> this issue, and I don't have a reproducer script
>
> One thing I should mention is that the schema of the publisher and subscriber
> are completely identical; the subscriber was created using
> pg_createsubscriber, and has not had any DDL applied (except for temp tables)
> since. I know that there is a risk of deadlocks in the case of schema
> differences, but there certainly isn't an extra index, constraint, or anything
> like that on the subscriber.

Thank you for reporting the issue. I reviewed the logs and query results but did
not find any evidence of a suspicious strong lock. Therefore, if possible, could
you please query pg_lock and pg_stat_activity separately? This will allow us to
determine whether there are any other wait events, besides strong locks, that
might be causing blocking.

Additionally, it might be worthwhile to check whether the parallel apply worker
is too slow to process all the changes on time. To investigate this, could you
intermittently query pg_stat_wal and pg_current_wal_insert_lsn() to see if the
if WAL inserts are continuously occurring, possibly initiated by the parallel
apply worker?

Lastly, as a precaution, could you please confirm whether there are any
other backends on the subscriber doing DMLs ?

Best Regards,
Hou zj
RE: Lock timeouts and unusual spikes in replication lag with logical parallel transaction streaming
On Monday, August 18, 2025 4:12 PM Zane Duffield <duffieldzane@gmail.com> wrote:
> On Mon, Aug 11, 2025 at 9:28 PM Zhijie Hou (Fujitsu)
> <mailto:houzj.fnst@fujitsu.com> wrote:
> > Thank you for reporting the issue. I reviewed the logs and query results but
> > did not find any evidence of a suspicious strong lock. Therefore, if
> > possible, could you please query pg_lock and pg_stat_activity separately?
> > This will allow us to determine whether there are any other wait events,
> > besides strong locks, that might be causing blocking.
>
> We tried reproducing the issue in a test environment and were not completely
> successful; we can reproduce the unusual spikes in replication lag (which
> correspond to restarts of the apply worker), but we cannot reproduce the stalled
> replication that we saw in production once.
>
> I suspect that these issues are related, and that the stalling is simply a more
> severe case of the lagging, so I hope that the extra logs I have collected will
> help diagnose the problem. Attached is a tarball (~17MB, with file extension
> _tgz because gmail wouldn't let me upload a .tgz) which contains a few files:
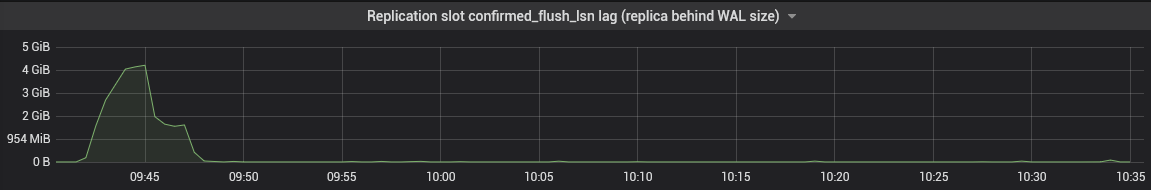
> 1. confirmed_flush_lsn_lag_graph_2025_08_09.png: a graph of the logical
> replication lag during the original incident, where replication falls behind
> and does not recover until we intervene and alter the subscription to disable
> parallel apply
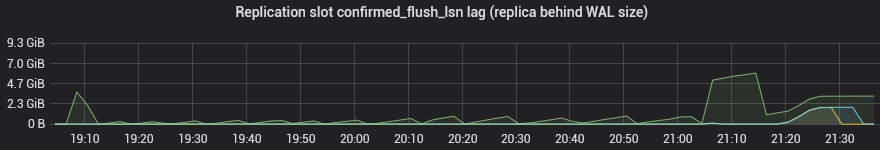
> 2. confirmed_flush_lsn_lag_graph_2025_08_13.png: the same graph, but during an
> attempt to recreate the issue
> 3. server.log: the subscriber's postgres server log during the attempt to
> recreate the issue
> 4. pg_stat_activity.log: a log of a periodic query of all of pg_stat_activity
> during the attempt to recreate the issue
> 5. pg_locks.log: a log of a periodic query of all of pg_locks during the attempt
> to recreate the issue Please note that the graphs are in UTC, but the logs are
> in UTC+1. Also note that some information has been redacted (server names,
> database identifiers, IP addresses).
>
> Another thing worth noting is that in the first graph, the blue and yellow lines
> correspond to two other subscribers that were configured with "streaming = off".
> You can clearly see that for the period where the green line ("streaming =
> parallel") is going up and down, the other subscribers have a practically flat
> line, only going up at the end before returning to zero.
Thanks for sharing the logs!
I noticed in the logs[1] that both the parallel apply worker and leader apply
worker are restarting at certain intervals, which could be the cause of the lag.
This might be due to a SIGINT triggered by a lock_timeout or statement_timeout,
although it's a bit weried that there are no timeout messages present in the
logs. If my assumption is correct, the behavior is understandable: the parallel
apply worker waits for the leader to send more data for the streamed transaction
by acquiring and waiting on a lock. However, the leader might be occupied with
other transactions, preventing it from sending additional data, which could
potentially lead to a lock timeout.
To confirm this, could you please provide the values you have set for
lock_timeout, statement_timeout (on subscriber), and logical_decoding_work_mem
(on publisher) ?
Additionally, for testing purposes, is it possible to disable these timeouts (by
setting the lock_timeout and statement_timeout GUCs to their default values) in
your testing environment to assess whether the lag still persists? This approach
can help us determine whether the timeouts are causing the lag.
[1]---
Aug 13 03:22:36.259 [2242351]: [952-1] LOG: logical replication parallel apply worker for subscription "sub1" has
finished
---
Best Regards,
Hou zj
RE: Lock timeouts and unusual spikes in replication lag with logical parallel transaction streaming
> On Monday, August 18, 2025 4:12 PM Zane Duffield
> <duffieldzane@gmail.com>  wrote:
> > On Mon, Aug 11, 2025 at 9:28 PM Zhijie Hou (Fujitsu)
> > <mailto:houzj.fnst@fujitsu.com> wrote:
> > > Thank you for reporting the issue. I reviewed the logs and query
> > > results but did not find any evidence of a suspicious strong lock.
> > > Therefore, if possible, could you please query pg_lock and pg_stat_activity
> separately?
> > > This will allow us to determine whether there are any other wait
> > > events, besides strong locks, that might be causing blocking.
> >
> > We tried reproducing the issue in a test environment and were not
> > completely successful; we can reproduce the unusual spikes in
> > replication lag (which correspond to restarts of the apply worker),
> > but we cannot reproduce the stalled replication that we saw in production
> once.
> >
> > I suspect that these issues are related, and that the stalling is
> > simply a more severe case of the lagging, so I hope that the extra
> > logs I have collected will help diagnose the problem. Attached is a
> > tarball (~17MB, with file extension _tgz because gmail wouldn't let me
> upload a .tgz) which contains a few files:
> > 1. confirmed_flush_lsn_lag_graph_2025_08_09.png: a graph of the logical
> >    replication lag during the original incident, where replication falls behind
> >    and does not recover until we intervene and alter the subscription to
> disable
> >    parallel apply
> > 2. confirmed_flush_lsn_lag_graph_2025_08_13.png: the same graph, but
> during an
> >    attempt to recreate the issue
> > 3. server.log: the subscriber's postgres server log during the attempt to
> >    recreate the issue
> > 4. pg_stat_activity.log: a log of a periodic query of all of pg_stat_activity
> >    during the attempt to recreate the issue 5. pg_locks.log: a log of
> > a periodic query of all of pg_locks during the attempt to recreate the
> > issue Please note that the graphs are in UTC, but the logs are in
> > UTC+1. Also note that some information has been redacted (server
> > names, database identifiers, IP addresses).
> >
> > Another thing worth noting is that in the first graph, the blue and
> > yellow lines correspond to two other subscribers that were configured with
> "streaming = off".
> > You can clearly see that for the period where the green line
> > ("streaming =
> > parallel") is going up and down, the other subscribers have a
> > practically flat line, only going up at the end before returning to zero.
>
> Thanks for sharing the logs!
>
> I noticed in the logs[1] that both the parallel apply worker and leader apply
> worker are restarting at certain intervals, which could be the cause of the lag.
> This might be due to a SIGINT triggered by a lock_timeout or statement_timeout,
> although it's a bit weried that there are no timeout messages present in the logs.
> If my assumption is correct, the behavior is understandable: the parallel apply
> worker waits for the leader to send more data for the streamed transaction by
> acquiring and waiting on a lock. However, the leader might be occupied with
> other transactions, preventing it from sending additional data, which could
> potentially lead to a lock timeout.
>
> To confirm this, could you please provide the values you have set for
> lock_timeout, statement_timeout (on subscriber), and
> logical_decoding_work_mem (on publisher) ?
>
> Additionally, for testing purposes, is it possible to disable these timeouts (by
> setting the lock_timeout and statement_timeout GUCs to their default values)
> in your testing environment to assess whether the lag still persists? This
> approach can help us determine whether the timeouts are causing the lag.
>
> [1]---
> Aug 13 03:22:36.259 [2242351]: [952-1] LOG:  logical replication parallel apply
> worker for subscription "sub1" has finished
> ---

By the way, if possible, could you share a script that can reproduce the
same log? It will be very helpful for us to debug it.

Best Regards,
Hou zj
> On Monday, August 18, 2025 4:12 PM Zane Duffield
> <duffieldzane@gmail.com> wrote:
> > On Mon, Aug 11, 2025 at 9:28 PM Zhijie Hou (Fujitsu)
> > <mailto:houzj.fnst@fujitsu.com> wrote:
> > > Thank you for reporting the issue. I reviewed the logs and query
> > > results but did not find any evidence of a suspicious strong lock.
> > > Therefore, if possible, could you please query pg_lock and pg_stat_activity
> separately?
> > > This will allow us to determine whether there are any other wait
> > > events, besides strong locks, that might be causing blocking.
> >
> > We tried reproducing the issue in a test environment and were not
> > completely successful; we can reproduce the unusual spikes in
> > replication lag (which correspond to restarts of the apply worker),
> > but we cannot reproduce the stalled replication that we saw in production
> once.
> >
> > I suspect that these issues are related, and that the stalling is
> > simply a more severe case of the lagging, so I hope that the extra
> > logs I have collected will help diagnose the problem. Attached is a
> > tarball (~17MB, with file extension _tgz because gmail wouldn't let me
> upload a .tgz) which contains a few files:
> > 1. confirmed_flush_lsn_lag_graph_2025_08_09.png: a graph of the logical
> > replication lag during the original incident, where replication falls behind
> > and does not recover until we intervene and alter the subscription to
> disable
> > parallel apply
> > 2. confirmed_flush_lsn_lag_graph_2025_08_13.png: the same graph, but
> during an
> > attempt to recreate the issue
> > 3. server.log: the subscriber's postgres server log during the attempt to
> > recreate the issue
> > 4. pg_stat_activity.log: a log of a periodic query of all of pg_stat_activity
> > during the attempt to recreate the issue 5. pg_locks.log: a log of
> > a periodic query of all of pg_locks during the attempt to recreate the
> > issue Please note that the graphs are in UTC, but the logs are in
> > UTC+1. Also note that some information has been redacted (server
> > names, database identifiers, IP addresses).
> >
> > Another thing worth noting is that in the first graph, the blue and
> > yellow lines correspond to two other subscribers that were configured with
> "streaming = off".
> > You can clearly see that for the period where the green line
> > ("streaming =
> > parallel") is going up and down, the other subscribers have a
> > practically flat line, only going up at the end before returning to zero.
>
> Thanks for sharing the logs!
>
> I noticed in the logs[1] that both the parallel apply worker and leader apply
> worker are restarting at certain intervals, which could be the cause of the lag.
> This might be due to a SIGINT triggered by a lock_timeout or statement_timeout,
> although it's a bit weried that there are no timeout messages present in the logs.
> If my assumption is correct, the behavior is understandable: the parallel apply
> worker waits for the leader to send more data for the streamed transaction by
> acquiring and waiting on a lock. However, the leader might be occupied with
> other transactions, preventing it from sending additional data, which could
> potentially lead to a lock timeout.
>
> To confirm this, could you please provide the values you have set for
> lock_timeout, statement_timeout (on subscriber), and
> logical_decoding_work_mem (on publisher) ?
statement_timeout = 4h
logical_decoding_work_mem = 64MB
>
> Additionally, for testing purposes, is it possible to disable these timeouts (by
> setting the lock_timeout and statement_timeout GUCs to their default values)
> in your testing environment to assess whether the lag still persists? This
> approach can help us determine whether the timeouts are causing the lag.
> [1]---
> Aug 13 03:22:36.259 [2242351]: [952-1] LOG: logical replication parallel apply
> worker for subscription "sub1" has finished
> ---
By the way, if possible, could you share a script that can reproduce the
same log? It will be very helpful for us to debug it.
- connection opens
- transaction starts
- LOCK tab1 IN EXCLUSIVE MODE
- DELETE FROM tab1
- pseudo truncate, which I know is much less efficient than a proper TRUNCATE, especially with logical replication
- CREATE/INSERT some temp tables
- INSERT INTO tab1
- DELETE FROM tab1 WHERE ...
- INSERT INTO tab2 (single row)
- COMMIT
Вложения
RE: Lock timeouts and unusual spikes in replication lag with logical parallel transaction streaming
Dear Zane,

While analyzing your post and code, I found that parallel apply worker could not
accept the lock timeout. IIUC that's why lock timeout rarely reported and parallel apply
worker exits automatically.

Lock timeout is implemented by sending a SIGINT to the process. Backends set a
signal hander to StatementCancelHandler, which the process will error out while
waiting something. See CHECK_FOR_INTERRUPTS->ProcessInterrupts. The error
message would be: "canceling statement due to lock timeout".

Regarding the parallel apply worker, however, it overwrites the signal hander for
SIGINT; it is used to detect the shutdown request from the leader process. When
parallel apply worker receives, it will exit when it reaches the main loop. Apart
from above case, the process does not exit while waiting the lock, it does after
becoming idle or receives next chunks. The message is same as normal shutdown case.

IIUC, lock timeout should be enabled for all the processes which accesses and
modifies database objects, hence current state should be fixed.

My idea is to use different signal to request shutdown to parallel apply workers.
Since checkpointer and walsender use SIGUSR2 for the similar purpose, this patch
also uses it for parallel apply worker. This issue has existed since PG16.

Note that this does not actually solve the issue what initially reported; this
allows pa worker to report and exit the lock timeout. The replication lag cannot
be resolved only by this.
Per document [1], it is not recommended to set lock_timeout globally.

[1]: https://www.postgresql.org/docs/17/runtime-config-client.html#GUC-LOCK-TIMEOUT

Best regards,
Hayato Kuroda
FUJITSU LIMITED
Вложения
On Wed, Aug 20, 2025 at 11:08 AM Zane Duffield <duffieldzane@gmail.com> wrote:
>>
>> > On Monday, August 18, 2025 4:12 PM Zane Duffield
>> > <duffieldzane@gmail.com>  wrote:
>> > > On Mon, Aug 11, 2025 at 9:28 PM Zhijie Hou (Fujitsu)
>> > > <mailto:houzj.fnst@fujitsu.com> wrote:
>
>
> Yes, I think it is the cause of the lag (every peak lines up directly with a restart of the apply workers), but I'm
notsure how it relates to the complete stall shown in confirmed_flush_lsn_lag_graph_2025_08_09.png (attached again).
>
>>
>> > This might be due to a SIGINT triggered by a lock_timeout or statement_timeout,
>> > although it's a bit weried that there are no timeout messages present in the logs.
>> > If my assumption is correct, the behavior is understandable: the parallel apply
>> > worker waits for the leader to send more data for the streamed transaction by
>> > acquiring and waiting on a lock. However, the leader might be occupied with
>> > other transactions, preventing it from sending additional data, which could
>> > potentially lead to a lock timeout.
>> >
>> > To confirm this, could you please provide the values you have set for
>> > lock_timeout, statement_timeout (on subscriber), and
>> > logical_decoding_work_mem (on publisher) ?
>
>
> lock_timeout = 30s
> statement_timeout = 4h
> logical_decoding_work_mem = 64MB
>
>>
>> >
>> > Additionally, for testing purposes, is it possible to disable these timeouts (by
>> > setting the lock_timeout and statement_timeout GUCs to their default values)
>> > in your testing environment to assess whether the lag still persists? This
>> > approach can help us determine whether the timeouts are causing the lag.
>
>
> This was a good question. See the attached confirmed_flush_lsn_lag_graph_2025_08_19.png.
> After setting lock_timeout to zero, the periodic peaks of lag were eliminated, and the restarts of the apply workers
inthe log are also eliminated.
>

So, this was the reason. As explained by Hou-San, in his previous
response, such a lock_timeout can lead to parallel apply worker exit
while waiting for more data from the leader. I think you need to
either set lock_timeout as 0 or set it to a higher value similar to
what you set for statement_timeout.

>
> One other thing I wonder is whether autovacuum on the subscriber has anything to do with the lock timeouts. I'm not
surewhether this could explain the perpetually-restarting apply workers that we witnessed on 2025-08-09, though.
>

No, as per my understanding it is because parallel apply worker
exiting due to lock_timeout set in the test. Ideally, the patch
proposed by Kuroda-San should show in LOGs that the parallel worker is
exiting due to lock_timeout. Can you try that once?

--
With Regards,
Amit Kapila.
No, as per my understanding it is because parallel apply worker
exiting due to lock_timeout set in the test. Ideally, the patch
proposed by Kuroda-San should show in LOGs that the parallel worker is
exiting due to lock_timeout. Can you try that once?
On Thu, Sep 18, 2025 at 9:47 AM Zane Duffield <duffieldzane@gmail.com> wrote:
>
> Sorry for the late reply.
>
> After some more testing, we are going ahead with `streaming = parallel`, with the change to reset `lock_timeout` to
thedefault.
>
>> No, as per my understanding it is because parallel apply worker
>> exiting due to lock_timeout set in the test. Ideally, the patch
>> proposed by Kuroda-San should show in LOGs that the parallel worker is
>> exiting due to lock_timeout. Can you try that once?
>
>
> I don't think I'll have time to compile a patched version and run the tests again, sorry. Have this information in
thelog probably would have made it easier to work this whole problem out, though, so I hope someone else can test out
thechange and get it merged.
>

Thanks for the feedback. I'll take care of this once the release
freeze for 18 is over.

--
With Regards,
Amit Kapila.
On Mon, Sep 22, 2025 at 2:06 PM Amit Kapila <amit.kapila16@gmail.com> wrote:
>
> On Thu, Sep 18, 2025 at 9:47 AM Zane Duffield <duffieldzane@gmail.com> wrote:
> >
> > Sorry for the late reply.
> >
> > After some more testing, we are going ahead with `streaming = parallel`, with the change to reset `lock_timeout` to
thedefault.
> >
> >> No, as per my understanding it is because parallel apply worker
> >> exiting due to lock_timeout set in the test. Ideally, the patch
> >> proposed by Kuroda-San should show in LOGs that the parallel worker is
> >> exiting due to lock_timeout. Can you try that once?
> >
> >
> > I don't think I'll have time to compile a patched version and run the tests again, sorry. Have this information in
thelog probably would have made it easier to work this whole problem out, though, so I hope someone else can test out
thechange and get it merged.
> >
>
> Thanks for the feedback. I'll take care of this once the release
> freeze for 18 is over.
>

Pushed.

--
With Regards,
Amit Kapila.