Обсуждение: Some performance degradation in REL_16 vs REL_15
Greetengs!

Found that simple test pgbench -c20 -T20 -j8 gives approximately
for REL_15_STABLE at 5143f76:  336+-1 TPS
and
for REL_16_STABLE at 4ac7635f: 324+-1 TPS

The performance drop is approximately 3,5%  while the corrected standard deviation is only 0.3%.
See the raw_data.txt attached.

How do you think, is there any cause for concern here?

And is it worth spending time bisecting for the commit where this degradation may have occurred?

Would be glad for any comments and concerns.

With the best regards,

--
Anton A. Melnikov
Postgres Professional: http://www.postgrespro.com
The Russian Postgres Company
Вложения
On Thu, 12 Oct 2023 at 21:01, Anton A. Melnikov
<a.melnikov@postgrespro.ru> wrote:
>
> Greetengs!
>
> Found that simple test pgbench -c20 -T20 -j8 gives approximately
> for REL_15_STABLE at 5143f76:  336+-1 TPS
> and
> for REL_16_STABLE at 4ac7635f: 324+-1 TPS
>
> And is it worth spending time bisecting for the commit where this degradation may have occurred?

It would be interesting to know what's to blame here and if you can
attribute it to a certain commit.

David
On Thu, Oct 12, 2023 at 09:20:36PM +1300, David Rowley wrote:
> It would be interesting to know what's to blame here and if you can
> attribute it to a certain commit.

+1.
--
Michael
Вложения
Hi,

On 2023-10-12 11:00:22 +0300, Anton A. Melnikov wrote:
> Found that simple test pgbench -c20 -T20 -j8 gives approximately
> for REL_15_STABLE at 5143f76:  336+-1 TPS
> and
> for REL_16_STABLE at 4ac7635f: 324+-1 TPS
>
> The performance drop is approximately 3,5%  while the corrected standard deviation is only 0.3%.
> See the raw_data.txt attached.

Could you provide a bit more details about how you ran the benchmark?  The
reason I am asking is that ~330 TPS is pretty slow for -c20.  Even on spinning
rust and using the default settings, I get considerably higher results.

Oh - I do get results closer to yours if I use pgbench scale 1, causing a lot
of row level contention. What scale did you use?

Greetings,

Andres Freund
On 13.10.2023 05:05, Andres Freund wrote:
> Could you provide a bit more details about how you ran the benchmark?  The
> reason I am asking is that ~330 TPS is pretty slow for -c20.  Even on spinning
> rust and using the default settings, I get considerably higher results.
>
> Oh - I do get results closer to yours if I use pgbench scale 1, causing a lot
> of row level contention. What scale did you use?


I use default scale of 1.
And run the command sequence:
$pgbench -i bench
$sleep 1
$pgbench -c20 -T10 -j8
in a loop to get similar initial conditions for every "pgbench -c20 -T10 -j8" run.

Thanks for your interest!

With the best wishes,

--
Anton A. Melnikov
Postgres Professional: http://www.postgrespro.com
The Russian Postgres Company
initdb data >/dev/null 2>&1 #initdb on every round
pg_ctl -D data -l logfile start >/dev/null 2>&1 #start without changing any setting
pgbench -i postgres $scale >/dev/null 2>&1
sleep 1 >/dev/null 2>&1
pgbench -c20 -T10 -j8
...
CONFIGURE = '--enable-debug' '--prefix=/home/postgres/base' '--enable-depend' 'PKG_CONFIG_PATH=/usr/local/lib64/pkgconfig::/usr/lib/pkgconfig'
CC = gcc
CPPFLAGS = -D_GNU_SOURCE
CFLAGS = -Wall -Wmissing-prototypes -Wpointer-arith -Wdeclaration-after-statement -Werror=vla -Wendif-labels -Wmissing-format-attribute -Wimplicit-fallthrough=3 -Wcast-function-type -Wshadow=compatible-local -Wformat-security -fno-strict-aliasing -fwrapv -fexcess-precision=standard -Wno-format-truncation -Wno-stringop-truncation -g -O2
CFLAGS_SL = -fPIC
LDFLAGS = -Wl,--as-needed -Wl,-rpath,'/home/postgres/base/lib',--enable-new-dtags
LDFLAGS_EX =
LDFLAGS_SL =
LIBS = -lpgcommon -lpgport -lz -lreadline -lpthread -lrt -ldl -lm
VERSION = PostgreSQL 16.0
—-
Yuhang Qiu
Hi,

On 2023-10-16 11:04:25 +0300, Anton A. Melnikov wrote:
> On 13.10.2023 05:05, Andres Freund wrote:
> > Could you provide a bit more details about how you ran the benchmark?  The
> > reason I am asking is that ~330 TPS is pretty slow for -c20.  Even on spinning
> > rust and using the default settings, I get considerably higher results.
> >
> > Oh - I do get results closer to yours if I use pgbench scale 1, causing a lot
> > of row level contention. What scale did you use?
>
>
> I use default scale of 1.

That means you're largely going to be bottlenecked due to row level
contention. For read/write pgbench you normally want to use a scale that's
bigger than the client count, best by at least 2x.

Have you built postgres with assertions enabled or such?

What is the server configuration for both versions?


> And run the command sequence:
> $pgbench -i bench
> $sleep 1
> $pgbench -c20 -T10 -j8

I assume you also specify the database name here, given you specified it for
pgbench -i?

As you're not doing a new initdb here, the state of the cluster will
substantially depend on what has run before. This can matter substantially
because a cluster with prior substantial write activity will already have
initialized WAL files and can reuse them cheaply, whereas one without that
activity needs to initialize new files.  Although that matters a bit less with
scale 1, because there's just not a whole lot of writes.

At the very least you should trigger a checkpoint before or after pgbench
-i. The performance between having a checkpoint during the pgbench run or not
is substantially different, and if you're not triggering one explicitly, it'll
be up to random chance whether it happens during the run or not. It's less
important if you run pgbench for an extended time, but if you do it just for
10s...

E.g. on my workstation, if there's no checkpoint, I get around 633 TPS across
repeated runs, but if there's a checkpoint between pgbench -i and the pgbench
run, it's around 615 TPS.

Greetings,

Andres Freund
=?utf-8?B?6YKx5a6H6Iiq?= <iamqyh@gmail.com> writes:
> I wrote a script and test on branch REL_[10-16]_STABLE, and do see performance drop in REL_13_STABLE, which is about
1~2%.

I'm really skeptical that we should pay much attention to these numbers.
You've made several of the mistakes that we typically tell people not to
make when using pgbench:

* scale <= number of sessions means you're measuring a lot of
row-update contention

* once you crank up the scale enough to avoid that problem, running
with the default shared_buffers seems like a pretty poor choice

* 10-second runtime is probably an order of magnitude too small
to get useful, reliable numbers

On top of all that, discrepancies on the order of a percent or two
commonly arise from hard-to-control-for effects like the cache
alignment of hot spots in different parts of the code.  That means
that you can see changes of that size from nothing more than
day-to-day changes in completely unrelated parts of the code.

I'd get excited about say a 10% performance drop, because that's
probably more than noise; but I'm not convinced that any of the
differences you show here are more than noise.

            regards, tom lane
Hi, Andres!
Thanks for your patience and advice.
On 18.10.2023 07:10, Andres Freund wrote:
>> On 13.10.2023 05:05, Andres Freund wrote:
>>> Could you provide a bit more details about how you ran the benchmark? The
>>> reason I am asking is that ~330 TPS is pretty slow for -c20. Even on spinning
>>> rust and using the default settings, I get considerably higher results.
>>>
>>> Oh - I do get results closer to yours if I use pgbench scale 1, causing a lot
>>> of row level contention. What scale did you use?
>> I use default scale of 1.
>
> That means you're largely going to be bottlenecked due to row level
> contention. For read/write pgbench you normally want to use a scale that's
> bigger than the client count, best by at least 2x.
I performed differential measurements with -s21 to obtain scale > number
in accordance with:
> On 18.10.2023 07:14, Tom Lane wrote:
>> * scale <= number of sessions means you're measuring a lot of
>> row-update contention
>>
And plan to do the same for -s40.
> Have you built postgres with assertions enabled or such?
I ran the debug configuration with --enable-cassert and -O0.
And plan to do the same without asserts and -O2 soon.
> What is the server configuration for both versions?
In all measurements i used default postgresql.conf files. Please see the detailed reproduction below.
>
>> And run the command sequence:
>> $pgbench -i bench
>> $sleep 1
>> $pgbench -c20 -T10 -j8
>
> I assume you also specify the database name here, given you specified it for
> pgbench -i?
Sorry, there were a two mistakes in the command sequence that I copied in the previous letter
compared to the real one. I did not completely copy it from the sighting, not from the real script.
In fact i used pgbench -c20 -T20 -j8 bench. -T10 is really unstable and was used only for
preliminary measurements to make them more faster. Please see my first letter in this thread.
Here are the detailed description of the last measurements that were performed on my pc.
With a scale of -s21, the difference between REL_16 and REL_15 is rather small, but it has
a cumulative effect from version to version and reaches a maximum between
REL_10_STABLE and REL_16_STABLE.
The measurement procedure was as follows;
- rebuild from sources and reinstall server with
./configure --enable-debug --enable-cassert --with-perl \
--with-icu --enable-depend --enable-tap-tests
- init the new empty db with initdb -k -D $INSTDIR/data
See postgresql10.conf and postgresql16.conf attached.
- run the series of 100 measurements with the scripts like that for REL_16:
date && rm -f result.txt && for ((i=0; i<100; i++)); do pgbench -U postgres -i -s21 bench> /dev/null 2>&1;
psql -U postgres -d bench -c "checkpoint"; RES=$(pgbench -U postgres -c20 -T20 -j8 bench 2>&1 | awk '/tps[[:space:]]/ {
print$3 }');
echo $RES >> result.txt; echo Measurement N$i done. TPS=$RES; done; cat result.txt
or
date && rm -f result.txt && for ((i=0; i<100; i++)); do pgbench -U postgres -i -s21 bench> /dev/null 2>&1;
psql -U postgres -d bench -c "checkpoint"; RES=$(pgbench -U postgres -c20 -T20 -j8 bench 2>&1 | awk '/excluding/ {
print$3 }');
echo $RES >> result.txt; echo Measurement N$i done. TPS=$RES; done; cat result.txt
for REL_10 respectively.
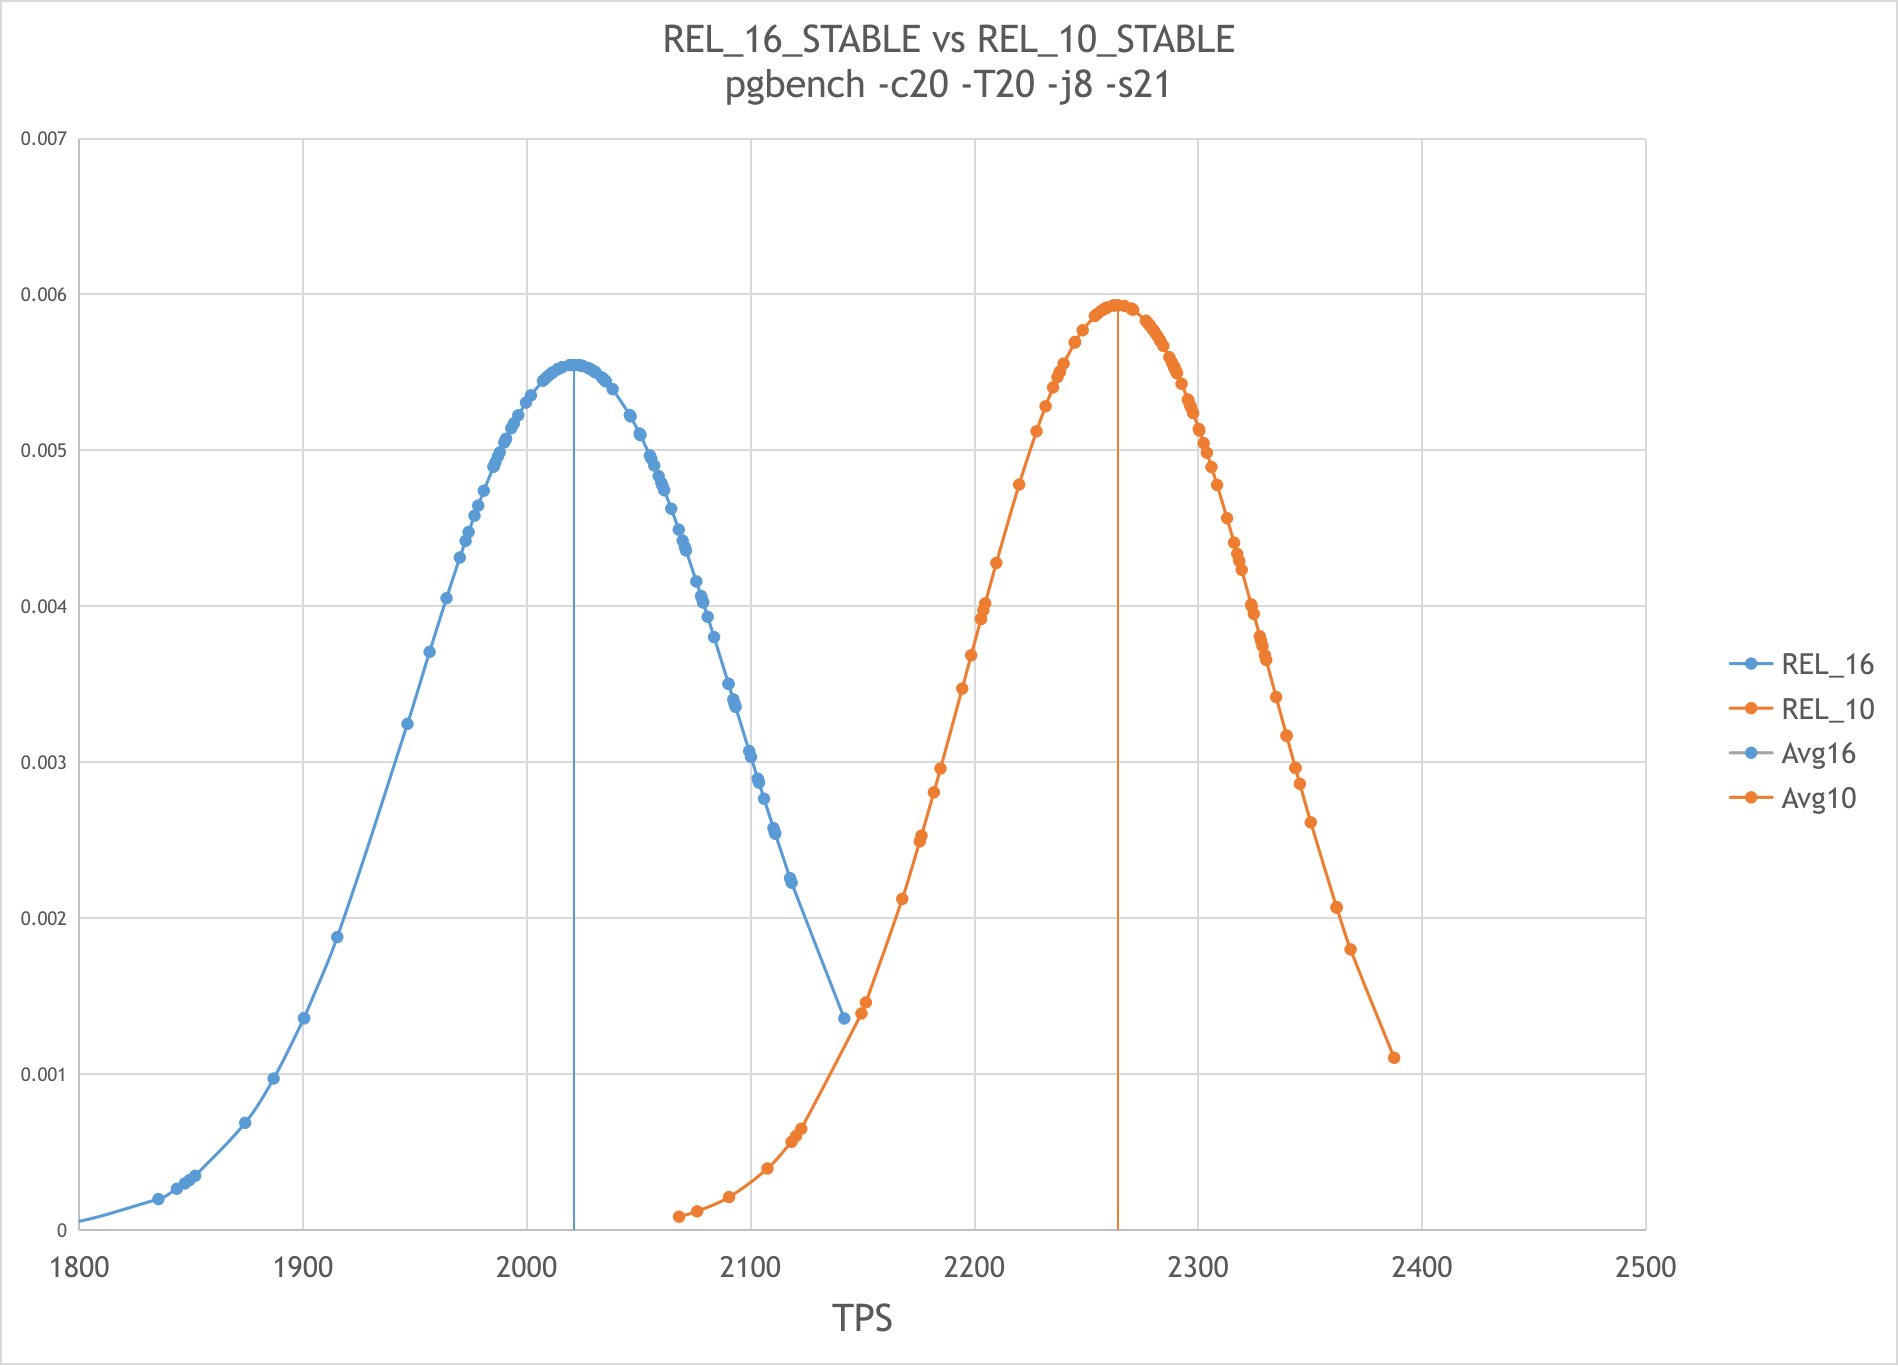
For REL_16_STABLE at 7cc2f59dd the average TPS was: 2020+-70,
for REL_10_STABLE at c18c12c98 - 2260+-70
The percentage difference was approximately 11%.
Please see the 16vs10.png picture with the graphical representation of the data obtained.
Also there are the raw data in the raw_data_s21.txt.
In some days i hope to perform additional measurements that were mentioned above in this letter.
It would be interesting to establish the reason for this difference. And i would be very grateful
if you could advise me what other settings can be tweaked.
With the best wishes!
--
Anton A. Melnikov
Postgres Professional: http://www.postgrespro.com
The Russian Postgres Company
Вложения
Hi,

On 2023-10-30 15:28:53 +0300, Anton A. Melnikov wrote:
> For REL_16_STABLE at 7cc2f59dd the average TPS was: 2020+-70,
> for REL_10_STABLE at c18c12c98 - 2260+-70
>
> The percentage difference was approximately 11%.
> Please see the 16vs10.png picture with the graphical representation of the data obtained.
> Also there are the raw data in the raw_data_s21.txt.
>
> In some days i hope to perform additional measurements that were mentioned above in this letter.
> It would be interesting to establish the reason for this difference. And  i would be very grateful
> if you could advise me what other settings can be tweaked.

There's really no point in comparing peformance with assertions enabled
(leaving aside assertions that cause extreme performance difference, making
development harder). We very well might have added assertions making things
more expensive, without affecting performance in optimized/non-assert builds.

Greetings,

Andres Freund
On 30.10.2023 22:51, Andres Freund wrote:

> There's really no point in comparing peformance with assertions enabled
> (leaving aside assertions that cause extreme performance difference, making
> development harder). We very well might have added assertions making things
> more expensive, without affecting performance in optimized/non-assert builds.
>

Thanks for advice! I repeated measurements on my pc without asserts and CFLAGS="-O2".
Also i reduced the number of clients to -c6 to leave a reserve of two cores
from my 8-core cpu and used -j6 accordingly.

The results were similar: on my pc REL_10_STABLE(c18c12c9) was faster than REL_16_STABLE(07494a0d)
but the effect became weaker:
  REL_10_STABLE gives ~965+-15 TPS(+-2%) while REL_16_STABLE gives ~920+-30 TPS(+-3%) in the test: pgbench -s8 -c6 -T20
-j6
So 10 is faster than 16 by ~5%. (see raw-my-pc.txt attached for the raw data)

Then, thanks to my colleagues, i carried out similar measurements on the more powerful 24-core standalone server.
The REL_10_STABLE gives 8260+-100 TPS(+-1%) while REL_16_STABLE gives 8580+-90 TPS(+-1%) in the same test: pgbench -s8
-c6-T20 -j6

The test gave an opposite result!
On that server the 16 is faster than 10 by ~4%.

When i scaled the test on server to get the same reserve of two cores, the results became like this:
REL_10_STABLE gives ~16000+-300 TPS(+-2%) while REL_16_STABLE gives ~18500+-200 TPS(+-1%) in the scaled test: pgbench
-s24-c22 -T20 -j22

Here the difference is more noticeable: 16 is faster than 10 by ~15%. (raw-server.txt)

The configure options and test scripts on my pc and server were the same:
export CFLAGS="-O2"
./configure --enable-debug --with-perl --with-icu --enable-depend --enable-tap-tests
#reinstall
#reinitdb
#create database bench
for ((i=0; i<100; i++)); do pgbench -U postgres -i -s8 bench> /dev/null 2>&1;
psql -U postgres -d bench -c "checkpoint"; RES=$(pgbench -U postgres -c6 -T20 -j6 bench;

Configurations:
my pc:  8-core AMD Ryzen 7 4700U @ 1.4GHz, 64GB RAM, NVMe M.2 SSD drive.
Linux 5.15.0-88-generic #98~20.04.1-Ubuntu SMP Mon Oct 9 16:43:45 UTC 2023 x86_64 x86_64 x86_64 GNU/Linux
server: 2x 12-hyperthreaded cores Intel(R) Xeon(R) CPU X5675 @ 3.07GHz, 24GB RAM, RAID from SSD drives.
Linux 5.10.0-21-amd64 #1 SMP Debian 5.10.162-1 (2023-01-21) x86_64 GNU/Linux

I can't understand why i get the opposite results on my pc and on the server. It is clear that the absolute
TPS values will be different for various configurations. This is normal. But differences?
Is it unlikely that some kind of reference configuration is needed to accurately
measure the difference in performance. Probably something wrong with my pc, but now
i can not figure out what's wrong.

Would be very grateful for any advice or comments to clarify this problem.

With the best wishes!

--
Anton A. Melnikov
Postgres Professional: http://www.postgrespro.com
The Russian Postgres Company
Вложения
"Anton A. Melnikov" <a.melnikov@postgrespro.ru> writes:
> I can't understand why i get the opposite results on my pc and on the server. It is clear that the absolute
> TPS values will be different for various configurations. This is normal. But differences?
> Is it unlikely that some kind of reference configuration is needed to accurately
> measure the difference in performance. Probably something wrong with my pc, but now
> i can not figure out what's wrong.

> Would be very grateful for any advice or comments to clarify this problem.

Benchmarking is hard :-(.  IME it's absolutely typical to see
variations of a couple of percent even when "nothing has changed",
for example after modifying some code that's nowhere near any
hot code path for the test case.  I usually attribute this to
cache effects, such as a couple of bits of hot code now sharing or
not sharing a cache line.  If you use two different compiler versions
then that situation is likely to occur all over the place even with
exactly the same source code.  NUMA creates huge reproducibility
problems too on multisocket machines (which your server is IIUC).
When I had a multisocket workstation I'd usually bind all the server
processes to one socket if I wanted more-or-less-repeatable numbers.

I wouldn't put a lot of faith in the idea that measured pgbench
differences of up to several percent are meaningful at all,
especially when comparing across different hardware and different
OS+compiler versions.  There are too many variables that have
little to do with the theoretical performance of the source code.

            regards, tom lane
Hi,

On 2023-11-15 11:33:44 +0300, Anton A. Melnikov wrote:
> The configure options and test scripts on my pc and server were the same:
> export CFLAGS="-O2"
> ./configure --enable-debug --with-perl --with-icu --enable-depend --enable-tap-tests
> #reinstall
> #reinitdb
> #create database bench
> for ((i=0; i<100; i++)); do pgbench -U postgres -i -s8 bench> /dev/null 2>&1;
> psql -U postgres -d bench -c "checkpoint"; RES=$(pgbench -U postgres -c6 -T20 -j6 bench;

Even with scale 8 you're likely significantly impacted by contention. And
obviously WAL write latency. See below for why that matters.


> I can't understand why i get the opposite results on my pc and on the server. It is clear that the absolute
> TPS values will be different for various configurations. This is normal. But differences?
> Is it unlikely that some kind of reference configuration is needed to accurately
> measure the difference in performance. Probably something wrong with my pc, but now
> i can not figure out what's wrong.

One very common reason for symptoms like this are power-saving measures by the
CPU. In workloads where the CPU is not meaningfully utilized, the CPU will go
into a powersaving mode - which can cause workloads that are latency sensitive
to be badly affected.  Both because initially the cpu will just work at a
lower frequency and because it takes time to shift to a higher latency.


Here's an example:
I bound the server and psql to the same CPU core (nothing else is allowed to
use that core. And ran the following:

\o /dev/null
SELECT 1; SELECT 1; SELECT 1; SELECT pg_sleep(0.1); SELECT 1; SELECT 1; SELECT 1;
Time: 0.181 ms
Time: 0.085 ms
Time: 0.071 ms
Time: 100.474 ms
Time: 0.153 ms
Time: 0.077 ms
Time: 0.069 ms

You can see how the first query timing was slower, the next two were faster,
and then after the pg_sleep() it's slow again.


# tell the CPU to optimize for performance not power
cpupower frequency-set --governor performance

# disable going to lower power states
cpupower idle-set -D0

# disable turbo mode for consistent performance
echo 1 > /sys/devices/system/cpu/intel_pstate/no_turbo

Now the timings are:
Time: 0.038 ms
Time: 0.028 ms
Time: 0.025 ms
Time: 1000.262 ms (00:01.000)
Time: 0.027 ms
Time: 0.024 ms
Time: 0.023 ms

Look, fast and reasonably consistent timings.

Switching back:
Time: 0.155 ms
Time: 0.123 ms
Time: 0.074 ms
Time: 1001.235 ms (00:01.001)
Time: 0.120 ms
Time: 0.077 ms
Time: 0.068 ms


The perverse thing is that this often means that *reducing* the number of
instructions executed yields to *worse* behaviour when under non-sustained
load, because from the CPUs point of view there is less need to increase clock
speed.


To show how much of a difference that can make, I ran pgbench with a single
client on one core, and the server on another (so the CPU is idle inbetween):
numactl --physcpubind 11 pgbench -n -M prepared -P1 -S -c 1 -T10

With power optimized configuration:
latency average = 0.035 ms
latency stddev = 0.002 ms
initial connection time = 5.255 ms
tps = 28434.334672 (without initial connection time)

With performance optimized configuration:
latency average = 0.025 ms
latency stddev = 0.001 ms
initial connection time = 3.544 ms
tps = 40079.995935 (without initial connection time)

That's a whopping 1.4x in throughput!


Now, the same thing, except that I used a custom workload where pgbench
transactions are executed in a pipelined fashion, 100 read-only transactions
in one script execution:

With power optimized configuration:
latency average = 1.055 ms
latency stddev = 0.125 ms
initial connection time = 6.915 ms
tps = 947.985286 (without initial connection time)

(this means we actually executed 94798.5286 readonly pgbench transactions/s)

With performance optimized configuration:
latency average = 1.376 ms
latency stddev = 0.083 ms
initial connection time = 3.759 ms
tps = 726.849018 (without initial connection time)

Suddenly the super-duper performance optimized settings are worse (but note
that stddev is down)! I suspect the problem is that now because we disabled
idle states, the cpu ends up clocking *lower*, due to power usage.

If I just change the relevant *cores* to the performance optimized
configuration:

cpupower -c 10,11 idle-set -D0; cpupower -c 10,11 frequency-set --governor performance

latency average = 0.940 ms
latency stddev = 0.061 ms
initial connection time = 3.311 ms
tps = 1063.719116 (without initial connection time)

It wins again.


Now, realistically you'd never use -D0 (i.e. disabling all downclocking, not
just lower states) - the power differential is quite big and as shown here it
can hurt performance as well.

On an idle system, looking at the cpu power usage with:
powerstat -D -R 5 1000

  Time    User  Nice   Sys  Idle    IO  Run Ctxt/s  IRQ/s Fork Exec Exit  Watts   pkg-0   dram  pkg-1
09:45:03   0.6   0.0   0.2  99.2   0.0    1   2861   2823    0    0    0  46.84   24.82   3.68  18.33
09:45:08   1.0   0.0   0.1  99.0   0.0    2   2565   1602    0    0    0  54.78   28.92   4.74  21.12
09:45:13   0.8   0.0   0.3  98.9   0.0    1   3769   2322    0    0    0  55.65   29.43   4.72  21.50
09:45:18   0.8   0.0   0.1  99.1   0.0    3   2513   1479    0    0    0  51.95   27.47   4.23  20.24
09:45:23   0.6   0.0   0.1  99.3   0.0    1   2282   1448    0    0    0  49.44   26.12   3.91  19.41
09:45:28   0.8   0.0   0.1  99.1   0.0    2   2422   1465    0    0    0  51.79   27.33   4.27  20.19
09:45:33   0.9   0.0   0.1  99.0   0.0    2   2358   1566    0    0    0  55.05   29.03   4.73  21.29
09:45:38   0.6   0.0   0.1  99.4   0.0    1   2976   4207    0    0    0  54.38   29.08   4.02  21.28
09:45:43   1.2   0.0   0.2  98.6   0.0    2   3988  37670    0    0    0 125.51   64.15   7.97  53.39
09:45:48   0.6   0.0   0.2  99.2   0.0    2   3263  40000    0    0    0 126.31   63.84   7.97  54.50
09:45:53   0.4   0.0   0.0  99.6   0.0    1   2333  39716    0    0    0 125.94   63.64   7.90  54.40
09:45:58   0.3   0.0   0.0  99.6   0.0    1   2783  39795    0    0    0 125.93   63.58   7.90  54.44
09:46:03   0.6   0.0   0.2  99.2   0.0    1   3081  24910    0    0    0  93.55   47.69   6.10  39.75
09:46:08   0.5   0.0   0.1  99.4   0.0    1   2623   1356    0    0    0  42.65   22.59   3.18  16.89

(interesting columns are Watts, pkg-0, dram, pkg-1)

Initially this was with cpupower idle-set -E, then I ran cpupower idle-set
-D0, and then cpupower idle-set -E - you can easily see where.


If I use a more sensible -D5 system-wide and run the pgbench from earlier, I
get the performance *and* sensible power usage:

latency average = 0.946 ms
latency stddev = 0.063 ms
initial connection time = 3.482 ms
tps = 1057.413946 (without initial connection time)

09:50:36   0.4   0.0   0.1  99.5   0.0    1   2593   1206    0    0    0  42.63   22.47   3.18  16.97


To get back to your benchmark: Because you're measuring a highly contended
system, where most of the time postgres will just wait for
  a) row-level locks to be released
  b) WAL writes to finish (you're clearly not using a very fast disk)
the CPU would have plenty time to clock down.


Benchmarking sucks. Modern hardware realities suck.

Greetings,

Andres Freund
Hi,

On 2023-11-15 10:09:06 -0500, Tom Lane wrote:
> "Anton A. Melnikov" <a.melnikov@postgrespro.ru> writes:
> > I can't understand why i get the opposite results on my pc and on the server. It is clear that the absolute
> > TPS values will be different for various configurations. This is normal. But differences?
> > Is it unlikely that some kind of reference configuration is needed to accurately
> > measure the difference in performance. Probably something wrong with my pc, but now
> > i can not figure out what's wrong.
>
> > Would be very grateful for any advice or comments to clarify this problem.
>
> Benchmarking is hard :-(.

Indeed.


> IME it's absolutely typical to see variations of a couple of percent even
> when "nothing has changed", for example after modifying some code that's
> nowhere near any hot code path for the test case.  I usually attribute this
> to cache effects, such as a couple of bits of hot code now sharing or not
> sharing a cache line.

FWIW, I think we're overusing that explanation in our community. Of course you
can encounter things like this, but the replacement policies of cpu caches
have gotten a lot better and the caches have gotten bigger too.

IME this kind of thing is typically dwarfed by much bigger variations from
things like

- cpu scheduling - whether the relevant pgbench thread is colocated on the
  same core as the relevant backend can make a huge difference,
  particularly when CPU power saving modes are not disabled.  Just looking at
  tps from a fully cached readonly pgbench, with a single client:

  Power savings enabled, same core:
  37493

  Power savings enabled, different core:
  28539

  Power savings disabled, same core:
  38167

  Power savings disabled, different core:
  37365


- can transparent huge pages be used for the executable mapping, or not

  On newer kernels linux (and some filesystems) can use huge pages for the
  executable. To what degree that succeeds is a large factor in performance.

  Single threaded read-only pgbench

  postgres mapped without huge pages:
  37155 TPS

  with 2MB of postgres as huge pages:
  37695 TPS

  with 6MB of postgres as huge pages:
  42733 TPS

  The really annoying thing about this is that entirely unpredictable whether
  huge pages are used or not. Building the same way, sometimes 0, sometimes 2MB,
  sometimes 6MB are mapped huge. Even though the on-disk contents are
  precisely the same.  And it can even change without rebuilding, if the
  binary is evicted from the page cache.

  This alone makes benchmarking extremely annoying. It basically can't be
  controlled and has huge effects.


- How long has the server been started

  If e.g. once you run your benchmark on the first connection to a database,
  and after a restart not (e.g. autovacuum starts up beforehand), you can get
  a fairly different memory layout and cache situation, due to [not] using the
  relcache init file. If not, you'll have a catcache that's populated,
  otherwise not.

  Another mean one is whether you start your benchmark within a relatively
  short time of the server starting. Readonly pgbench with a single client,
  started immediately after the server:

  progress: 12.0 s, 37784.4 tps, lat 0.026 ms stddev 0.001, 0 failed
  progress: 13.0 s, 37779.6 tps, lat 0.026 ms stddev 0.001, 0 failed
  progress: 14.0 s, 37668.2 tps, lat 0.026 ms stddev 0.001, 0 failed
  progress: 15.0 s, 32133.0 tps, lat 0.031 ms stddev 0.113, 0 failed
  progress: 16.0 s, 37564.9 tps, lat 0.027 ms stddev 0.012, 0 failed
  progress: 17.0 s, 37731.7 tps, lat 0.026 ms stddev 0.001, 0 failed

  There's a dip at 15s, odd - turns out that's due to bgwriter writing a WAL
  record, which triggers walwriter to write it out and then initialize the
  whole WAL buffers with 0s - happens once.  In this case I've exagerated the
  effect a bit by using a 1GB wal_buffers, but it's visible otherwise too.
  Whether your benchmark period includes that dip or not adds a fair bit of
  noise.

  You can even see the effects of autovacuum workers launching - even if
  there's nothing to do!  Not as a huge dip, but enough to add some "run to
  run" variation.


- How much other dirty data is there in the kernel pagecache. If you e.g. just
  built a new binary, even with just minor changes, the kernel will need to
  flush those pages eventually, which may contend for IO and increases page
  faults.

  Rebuilding an optimized build generates something like 1GB of dirty
  data. Particularly with ccache, that'll typically not yet be flushed by the
  time you run a benchmark. That's not nothing, even with a decent NVMe SSD.

- many more, unfortunately

Greetings,

Andres Freund
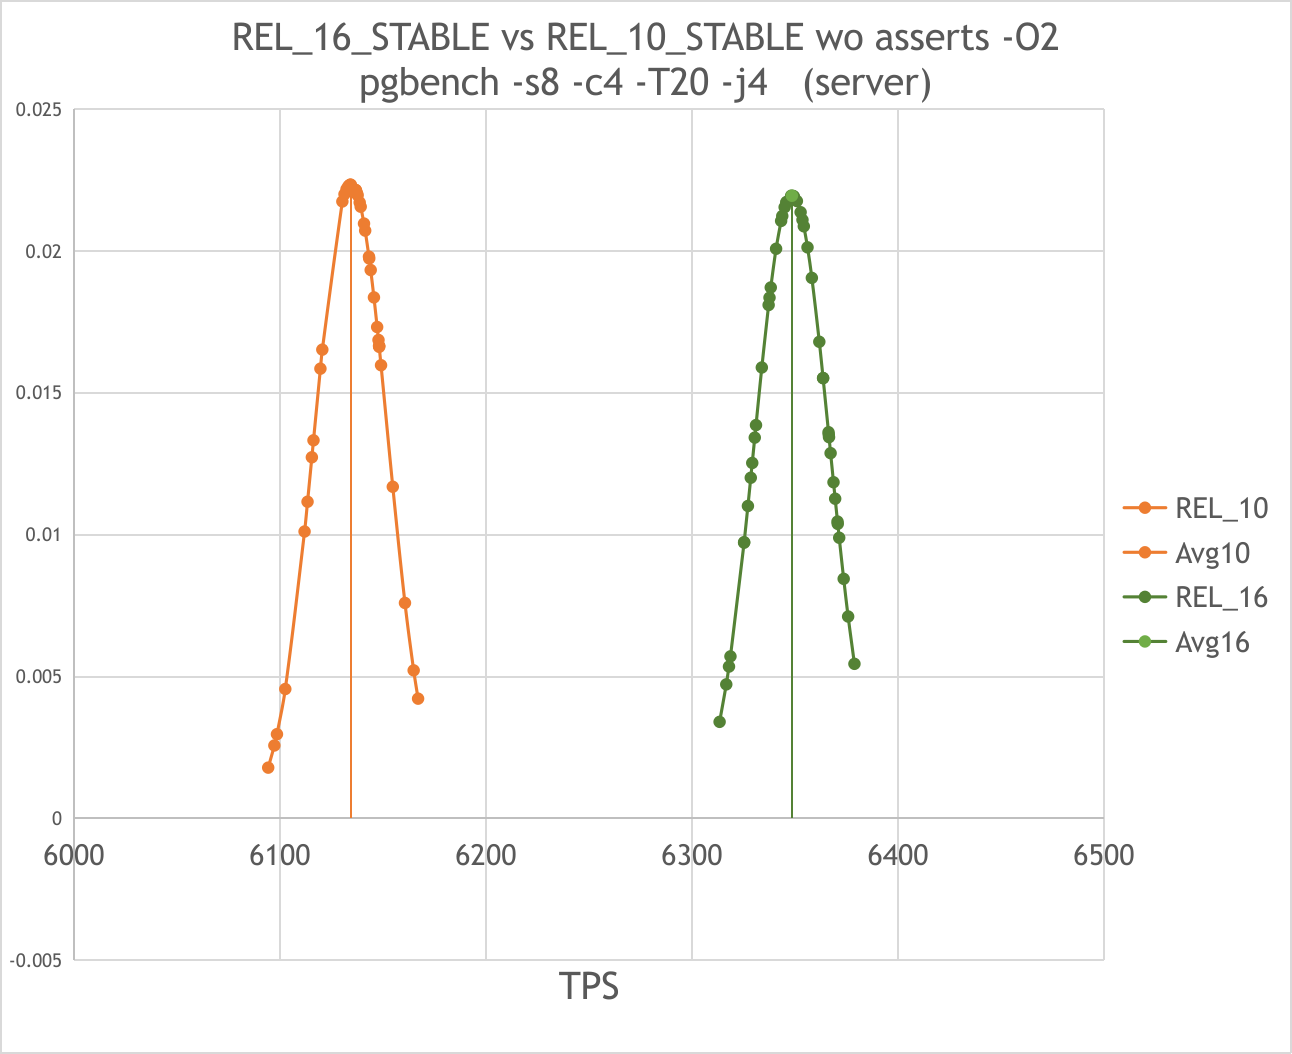
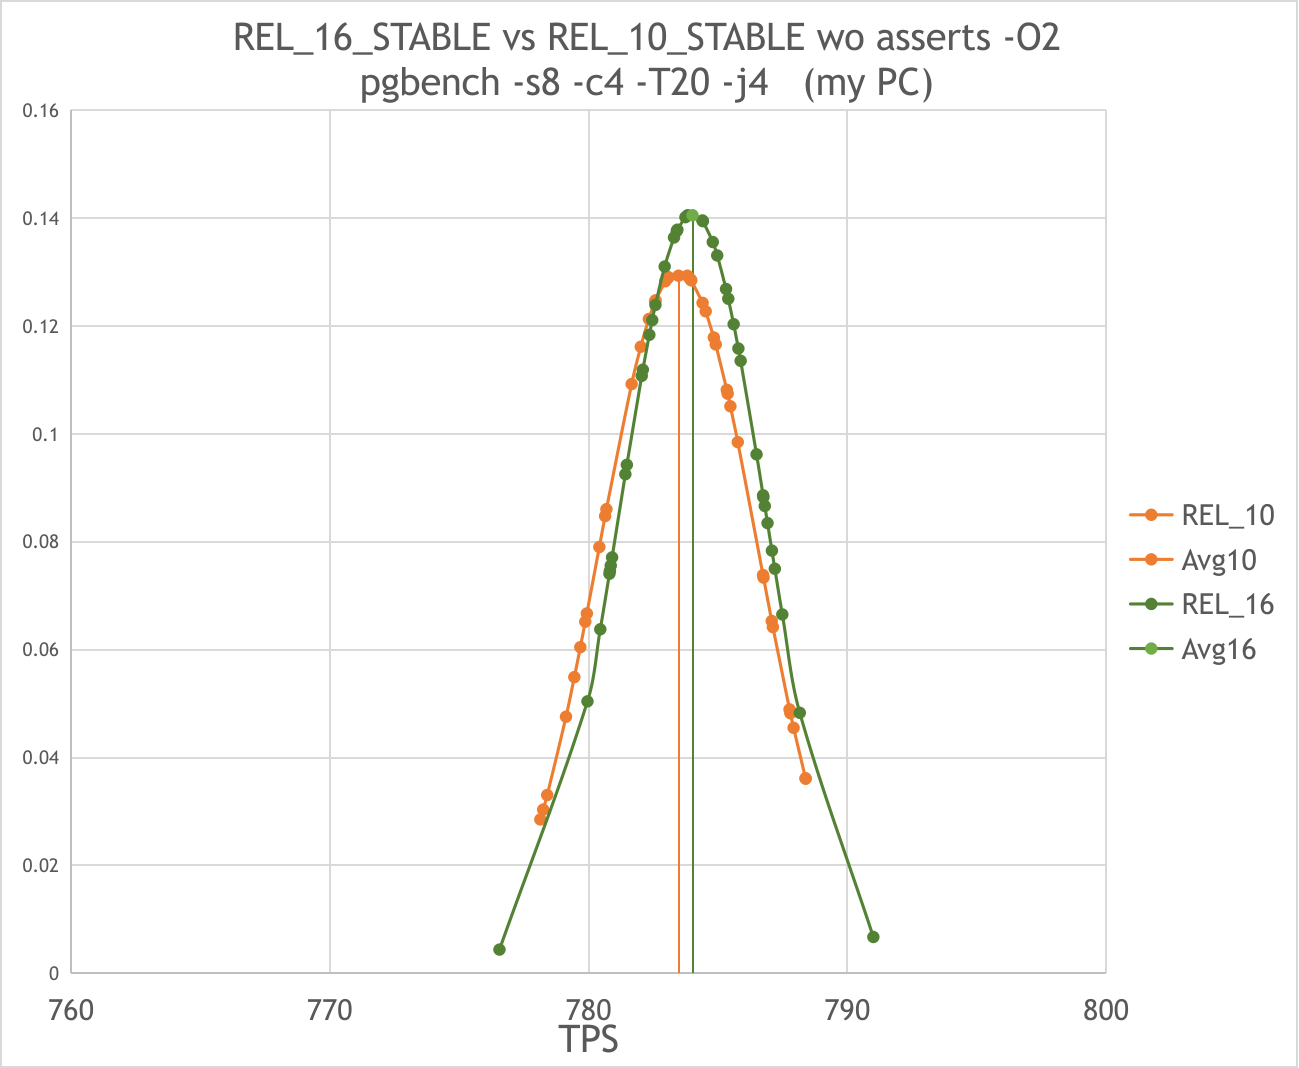
Hi!

Thank you very much for pointing out these important moments:

"NUMA" effects:
On 15.11.2023 18:09, Tom Lane wrote:
> NUMA creates huge reproducibility
> problems too on multisocket machines (which your server is IIUC).
> When I had a multisocket workstation I'd usually bind all the server
> processes to one socket if I wanted more-or-less-repeatable numbers.
>

"frequency" effects:
On 15.11.2023 21:04, Andres Freund wrote:
>
> One very common reason for symptoms like this are power-saving measures by the
> CPU. In workloads where the CPU is not meaningfully utilized, the CPU will go
> into a powersaving mode - which can cause workloads that are latency sensitive
> to be badly affected.  Both because initially the cpu will just work at a
> lower frequency and because it takes time to shift to a higher latency.

> To get back to your benchmark: Because you're measuring a highly contended
> system, where most of the time postgres will just wait for
>    a) row-level locks to be released
>    b) WAL writes to finish (you're clearly not using a very fast disk)
> the CPU would have plenty time to clock down.

And "huge page" effect:
On 15.11.2023 23:21, Andres Freund wrote:
>    The really annoying thing about this is that entirely unpredictable whether
>    huge pages are used or not. Building the same way, sometimes 0, sometimes 2MB,
>    sometimes 6MB are mapped huge. Even though the on-disk contents are
>    precisely the same.  And it can even change without rebuilding, if the
>    binary is evicted from the page cache.

As for "NUMA" and "frequency" effects the following steps were made.

As directed by Andres i really found that CPU cores sometimes were falling down in low-frequency
states during the test. See server-C1-C1E-falls.mkv attached.
Additionally, with my colleague Andrew Bille [<andrewbille(at)gmail(dot)com>]
we found an interesting thing.
We disabled software performance management in the server BIOS
and completely prohibited C-states here. But still,
the processor cores sometimes fell to C1 and C1E with a frequency decrease.
So we set back the software management in the BIOS and an additional command
echo <scaling_max_freq> | sudo tee /sys/devices/system/cpu/cpu*/cpufreq/scaling_min_freq
solved this problem. The server cores began to operate at a fixed
frequency as shown in: server-stable-freq.mkv
And a similar result was obtained on my pc: mypc-stable-freq.mkv

Then i brought the server and my pc hardware configuration as close as possible to each other.
There are eight real cores on my pc without hyperthreading. On the other hand there are
only six real cores in every cpu on the server. So it is impossible to obtain 8 real cores on single cpu here.
To align both  configurations i disable two of the 8 cores on my pc with numactl. On the server the second cpu was also
disabled
through numactl while the hyperthreading was disabled in the BIOS.
Finally we got a similar configuration of single six-core processor both on the server and on my pc.

Full set of the configuration commands for server was like that:
numactl --cpunodebind=0 --membind=0 --physcpubind=1,3,5,7,9,11 bash
sudo cpupower frequency-set -g performance
sudo cpupower idle-set -D0
echo 3059000 | sudo tee /sys/devices/system/cpu/cpu*/cpufreq/scaling_min_freq
(Turbo Boost was disabled in BIOS.)
And for my pc like that:
numactl --cpunodebind=0 --membind=0 --physcpubind=0,1,2,3,4,5 bash
sudo cpupower frequency-set -g performance
sudo cpupower idle-set -D0
echo 2000000 | sudo tee /sys/devices/system/cpu/cpu*/cpufreq/scaling_min_freq
echo 0 | sudo tee /sys/devices/system/cpu/cpufreq/boost

There are the numactl and cpupower output after configuration in
server-hw.txt and mypc-hw.txt respectively.

To eliminate the "huge page" effect i use huge_pages = off
in the all further differential measurements.

As for the other effects that Andres mentioned: dips due to bgwriter, autovacuum,
kernel pagecache effects and other possible noise,
i minimize the effect of them statistically using the following measurement sequence.
One series of such a measurement consists of:
1) Remove install and data dirs;
2) Fully reconfigure, rebuild and reinstall server;
3) Reinit new db;
4) Launch pgbench for 20 seconds in a loop with intermediate checkpoints, as you advised.
A few tens measurements totally.
5) Sort the results and remove points with considerable (more than 1%) deviation from tails.
The algorithm was as follows:
   if the fist or last point deviates from the average by more than 1% remove it;
   recalculate the average value;
   repeat from the begin.
Removed points marked with "x" in the raw data files raw-server.txt and raw-myPC.txt.
6) Get a result series of TPS data and average (expected) value
7) Calculate the standard deviation (error)
Each series takes approximately 20 minutes.

The general order of measurements was as follows:
1) Compare REL_10_STABLE vs REL_16_STABLE on my pc and take difference1 in TPS;
2) Compare REL_10_STABLE vs REL_16_STABLE at the same commits on server and take the difference2;
3) Compare difference1 and difference2 with each other.

In my first attempt i got exactly the opposite results. On my pc REL_10 was noticeably
faster than REL_16 while on the server the latter wins.

After repeating measurements using the updated configurations and methods described above
i got the following results:

On the server:
REL_10_STABLE gives ~6130 TPS(+-0.3%) while REL_16_STABLE gives ~6350 TPS(+-0.3%) in the test: pgbench -s8 -c4 -T20
-j4
In comparison with previous attempt the standard deviation became smaller by 3 times but difference
in speed remained almost the same:
the 16th is faster than 10th by ~3,6%. See 10vs16-server.png
(previous was ~4% in the pgbench -s8 -c6 -T20 -j6)

On my pc :
REL_10_STABLE gives ~783 TPS(+-0.4%) while REL_16_STABLE gives ~784 TPS(+-0.4%) in the same test: pgbench -s8 -c4 -T20
-j4
Here the difference in comparison with last attempt is significant. 10th and 16th no longer differ in speed while
the standard deviation became smaller by 5 times. See 10vs16-mypc.png

The results obtained on server seems more reliable as they are consistent with the previous ones
but i would like to figure out why i don’t see a difference in TPS on my PC.
Will be glad to any comments and and concerns.

And want to thank again for the previous advice. Owing to them the measurements have become more stable.

Merry Christmas and the best regards!

--
Anton A. Melnikov
Postgres Professional: http://www.postgrespro.com
The Russian Postgres Company
Вложения
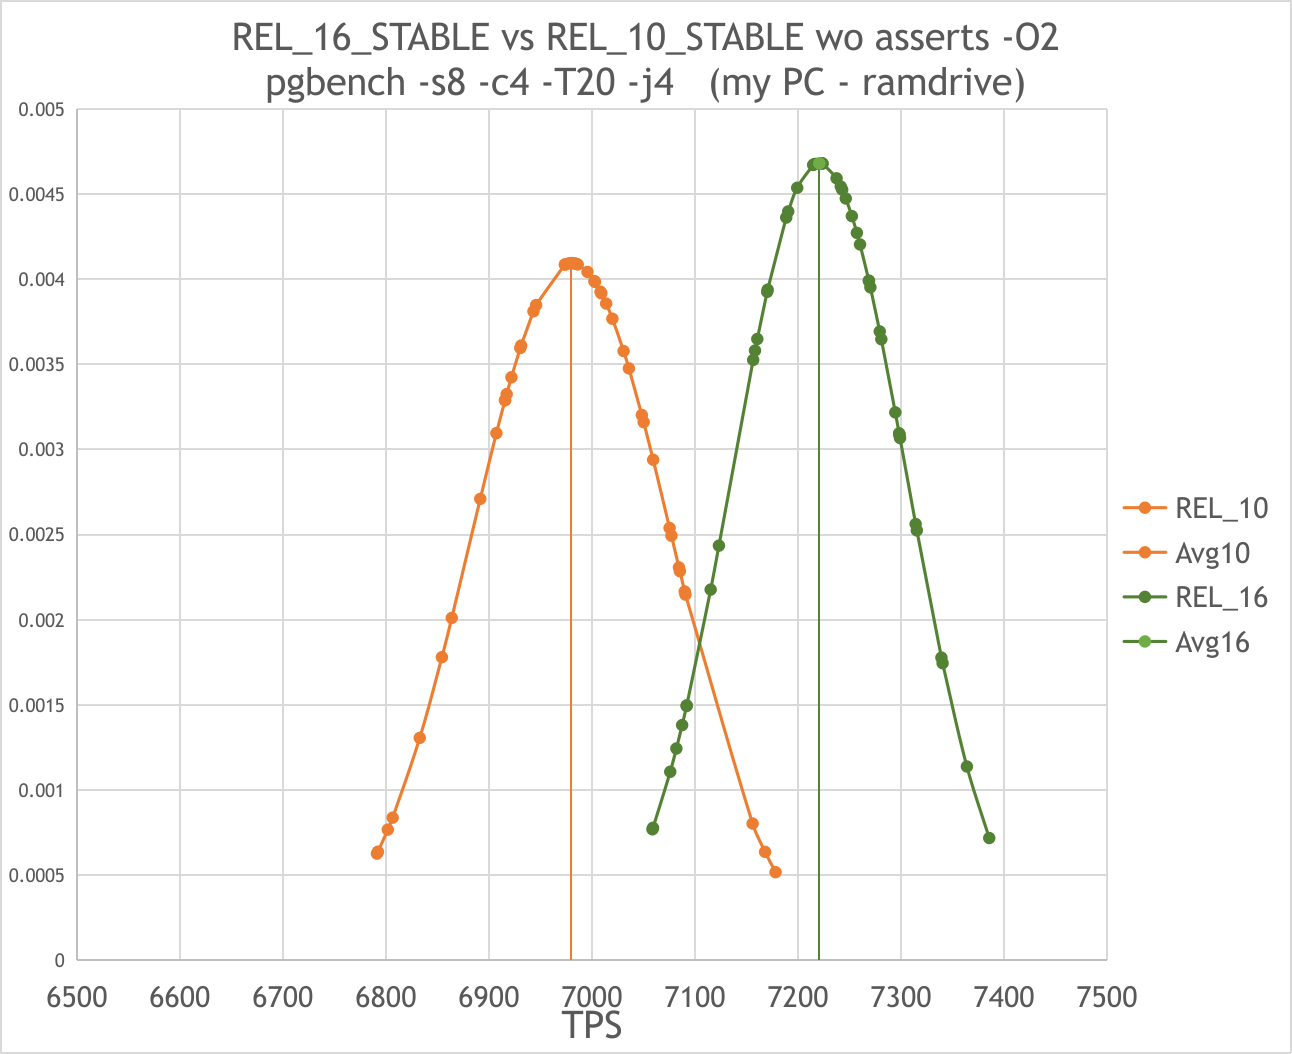
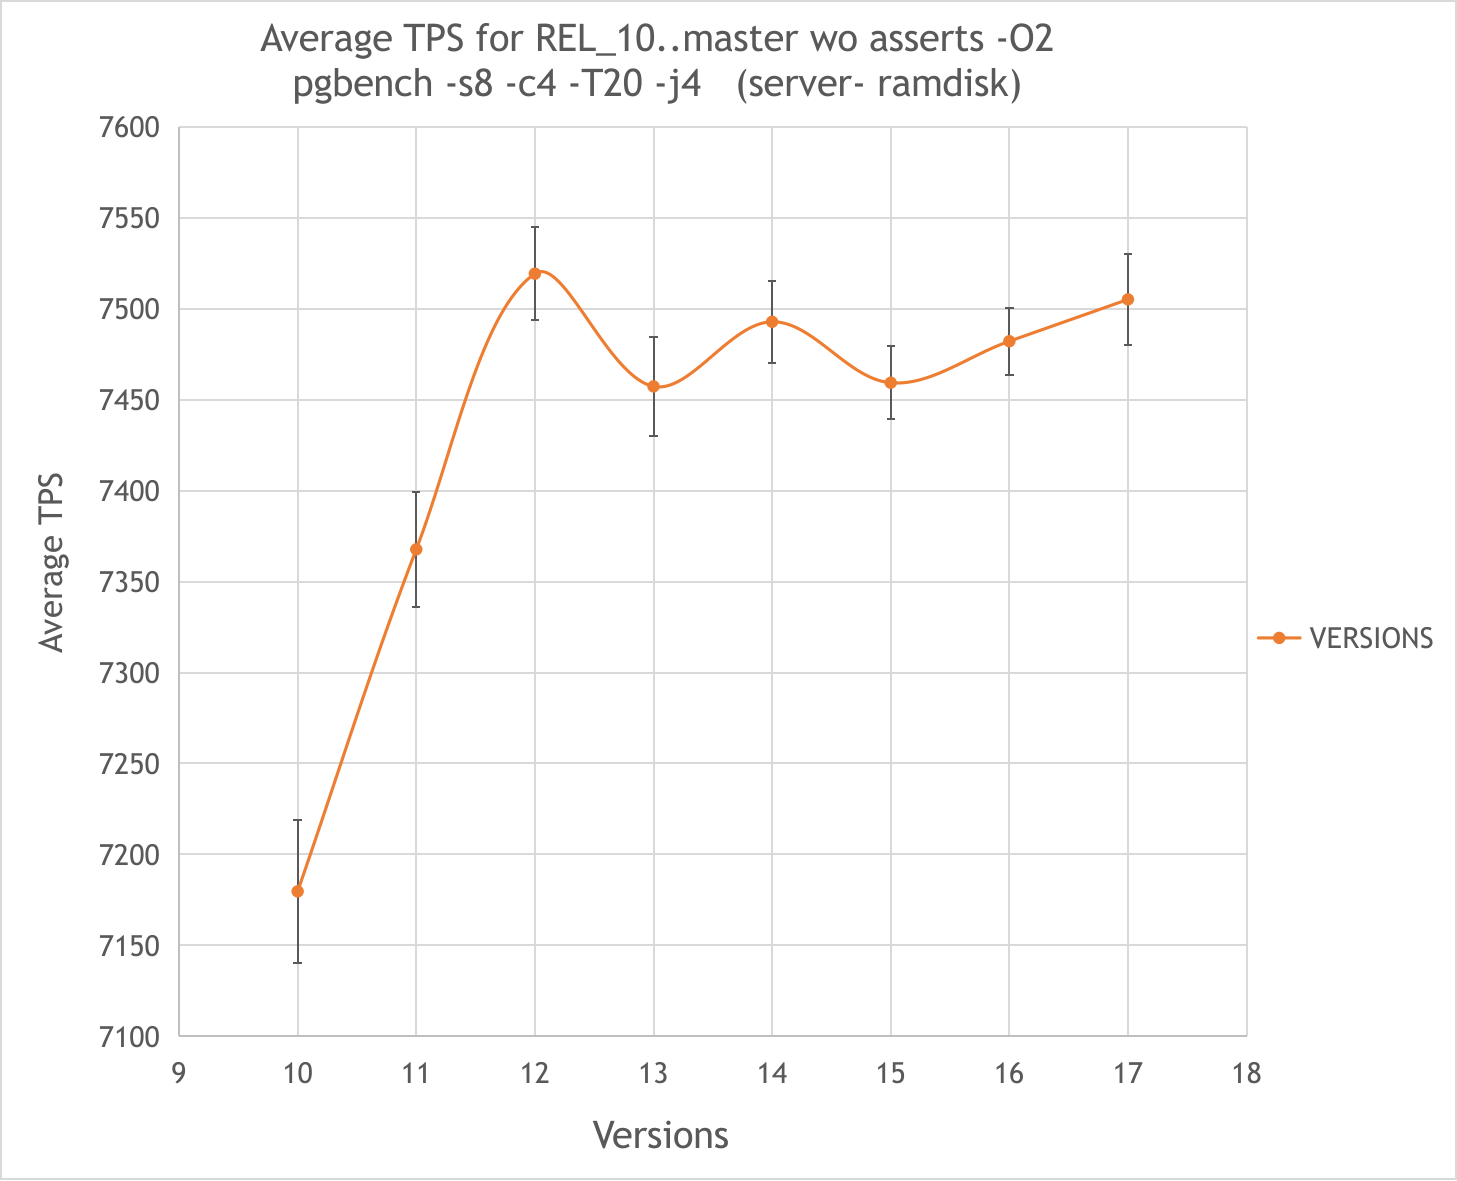
On 26.12.2023 07:38, Anton A. Melnikov wrote:
> The results obtained on server seems more reliable as they are consistent with the previous ones
> but i would like to figure out why i don’t see a difference in TPS on my PC.

Seems i found the solution.
Since the possible reason could be an I/O bottleneck, as firstly pointed by Thomas in [1] in similar measurements,
i took on my PC the same approach as in this thread [2] using a 12GB ramdisk from 64GB of my total RAM.

The REL_10_STABLE at c18c12c983 gives ~6900+-100 TPS (+-1.4%), while
REL_16_STABLE at 07494a0df gives ~7200+-90 TPS (+-1.3%). See raw data in the raw-myPC.txt
and graphical representation in the 16vs10-mypc.png

REL_16_STABLE is faster than REL_10_STABLE by ~4%.
So the results on my PC became in consistent with the ones obtained on the server.

Also i performed comparative measurements on the server with ramdrive for all current versions as of January 27th.
Please, see the dependence of the average TPS on the version number at the 10-to-master.png graph.
The raw data are here: raw-server.txt

Brief results are as follows:
1) Differences between 12th, 13th, 14th, 15th and master are subtle and within ~1%.
2) 11th slower than 12th..master by ~2%
3) 10th slower than 12th..master by ~4%
The standard deviation in all measurements except 10th and 11th was ~0.3%, for 11th ~0,4%, for 10th ~0,5%.

Thus, the problem in the subject of this thread is actually not relevant, there is no performance
degradation in REL_16 vs REL_15.

But i'm worried about such a question. If we do not take into account possible fluctuations of a few percent
from commit to commit we can gradually accumulate a considerable loss in performance without noticing it.
And then it will be quite difficult to establish its origin.
Perhaps i'm missing something here. If there any thoughts on this question
would be glad to take them into account.


With the best wishes!

--
Anton A. Melnikov
Postgres Professional: http://www.postgrespro.com
The Russian Postgres Company

[1] https://www.postgresql.org/message-id/98646b96-6dcf-8d8a-3daf-837f25f8b1e3%40enterprisedb.com
[2] https://www.postgresql.org/message-id/a74b5a91-d7c1-4138-86df-371c5e2b2be3%40postgrespro.ru