Обсуждение: Major pgbench synthetic SELECT workload regression, Ubuntu 23.04+PG15
Pushing SELECT statements at socket speeds with prepared statements is a synthetic benchmark that normally demos big pgbench numbers. My benchmark farm moved to Ubuntu 23.04/kernel 6.2.0-20 last month, and that test is badly broken on the system PG15 at larger core counts, with as much as an 85% drop from expectations. Since this is really just a benchmark workload the user impact is very narrow, probably zero really, but as the severity of the problem is high we should get to the bottom of what's going on.
First round of profile data suggests the lost throughput is going here:
Overhead Shared Object Symbol
74.34% [kernel] [k] osq_lock
2.26% [kernel] [k] mutex_spin_on_owner
While I'd like to just say this is a Linux issue and that's early adopter life with non-LTS Ubuntu releases, that doesn't explain why a PGDG PG14 works perfectly on the same systems?
Quick test to find if you're impacted: on the server and using sockets, run a 10 second SELECT test with/without preparation using 1 or 2 clients/[core|thread] and see if preparation is the slower result. Here's a PGDG PG14 on port 5434 as a baseline, next to Ubuntu 23.04's regular PG15, all using the PG15 pgbench on AMD 5950X:
$ pgbench -i -s 100 pgbench -p 5434
$ pgbench -S -T 10 -c 32 -j 32 -M prepared -p 5434 pgbench
pgbench (14.8 (Ubuntu 14.8-1.pgdg23.04+1))
tps = 1058195.197298 (without initial connection time)
$ pgbench -S -T 10 -c 32 -j 32 -p 5434 pgbench
pgbench (14.8 (Ubuntu 14.8-1.pgdg23.04+1))
tps = 553120.142503 (without initial connection time)
tps = 170952.097609 (without initial connection time)
$ pgbench -S -T 10 -c 32 -j 32 pgbench
pgbench (15.3 (Ubuntu 15.3-0ubuntu0.23.04.1))
tps = 314585.347022 (without initial connection time)
Connecting over sockets with preparation is usually a cheat code that lets newer/bigger processors clear a million TPS like I did here. I don't think that reflects any real use case given the unpopularity of preparation in ORMs, plus needing a local sockets connection to reach top rates.
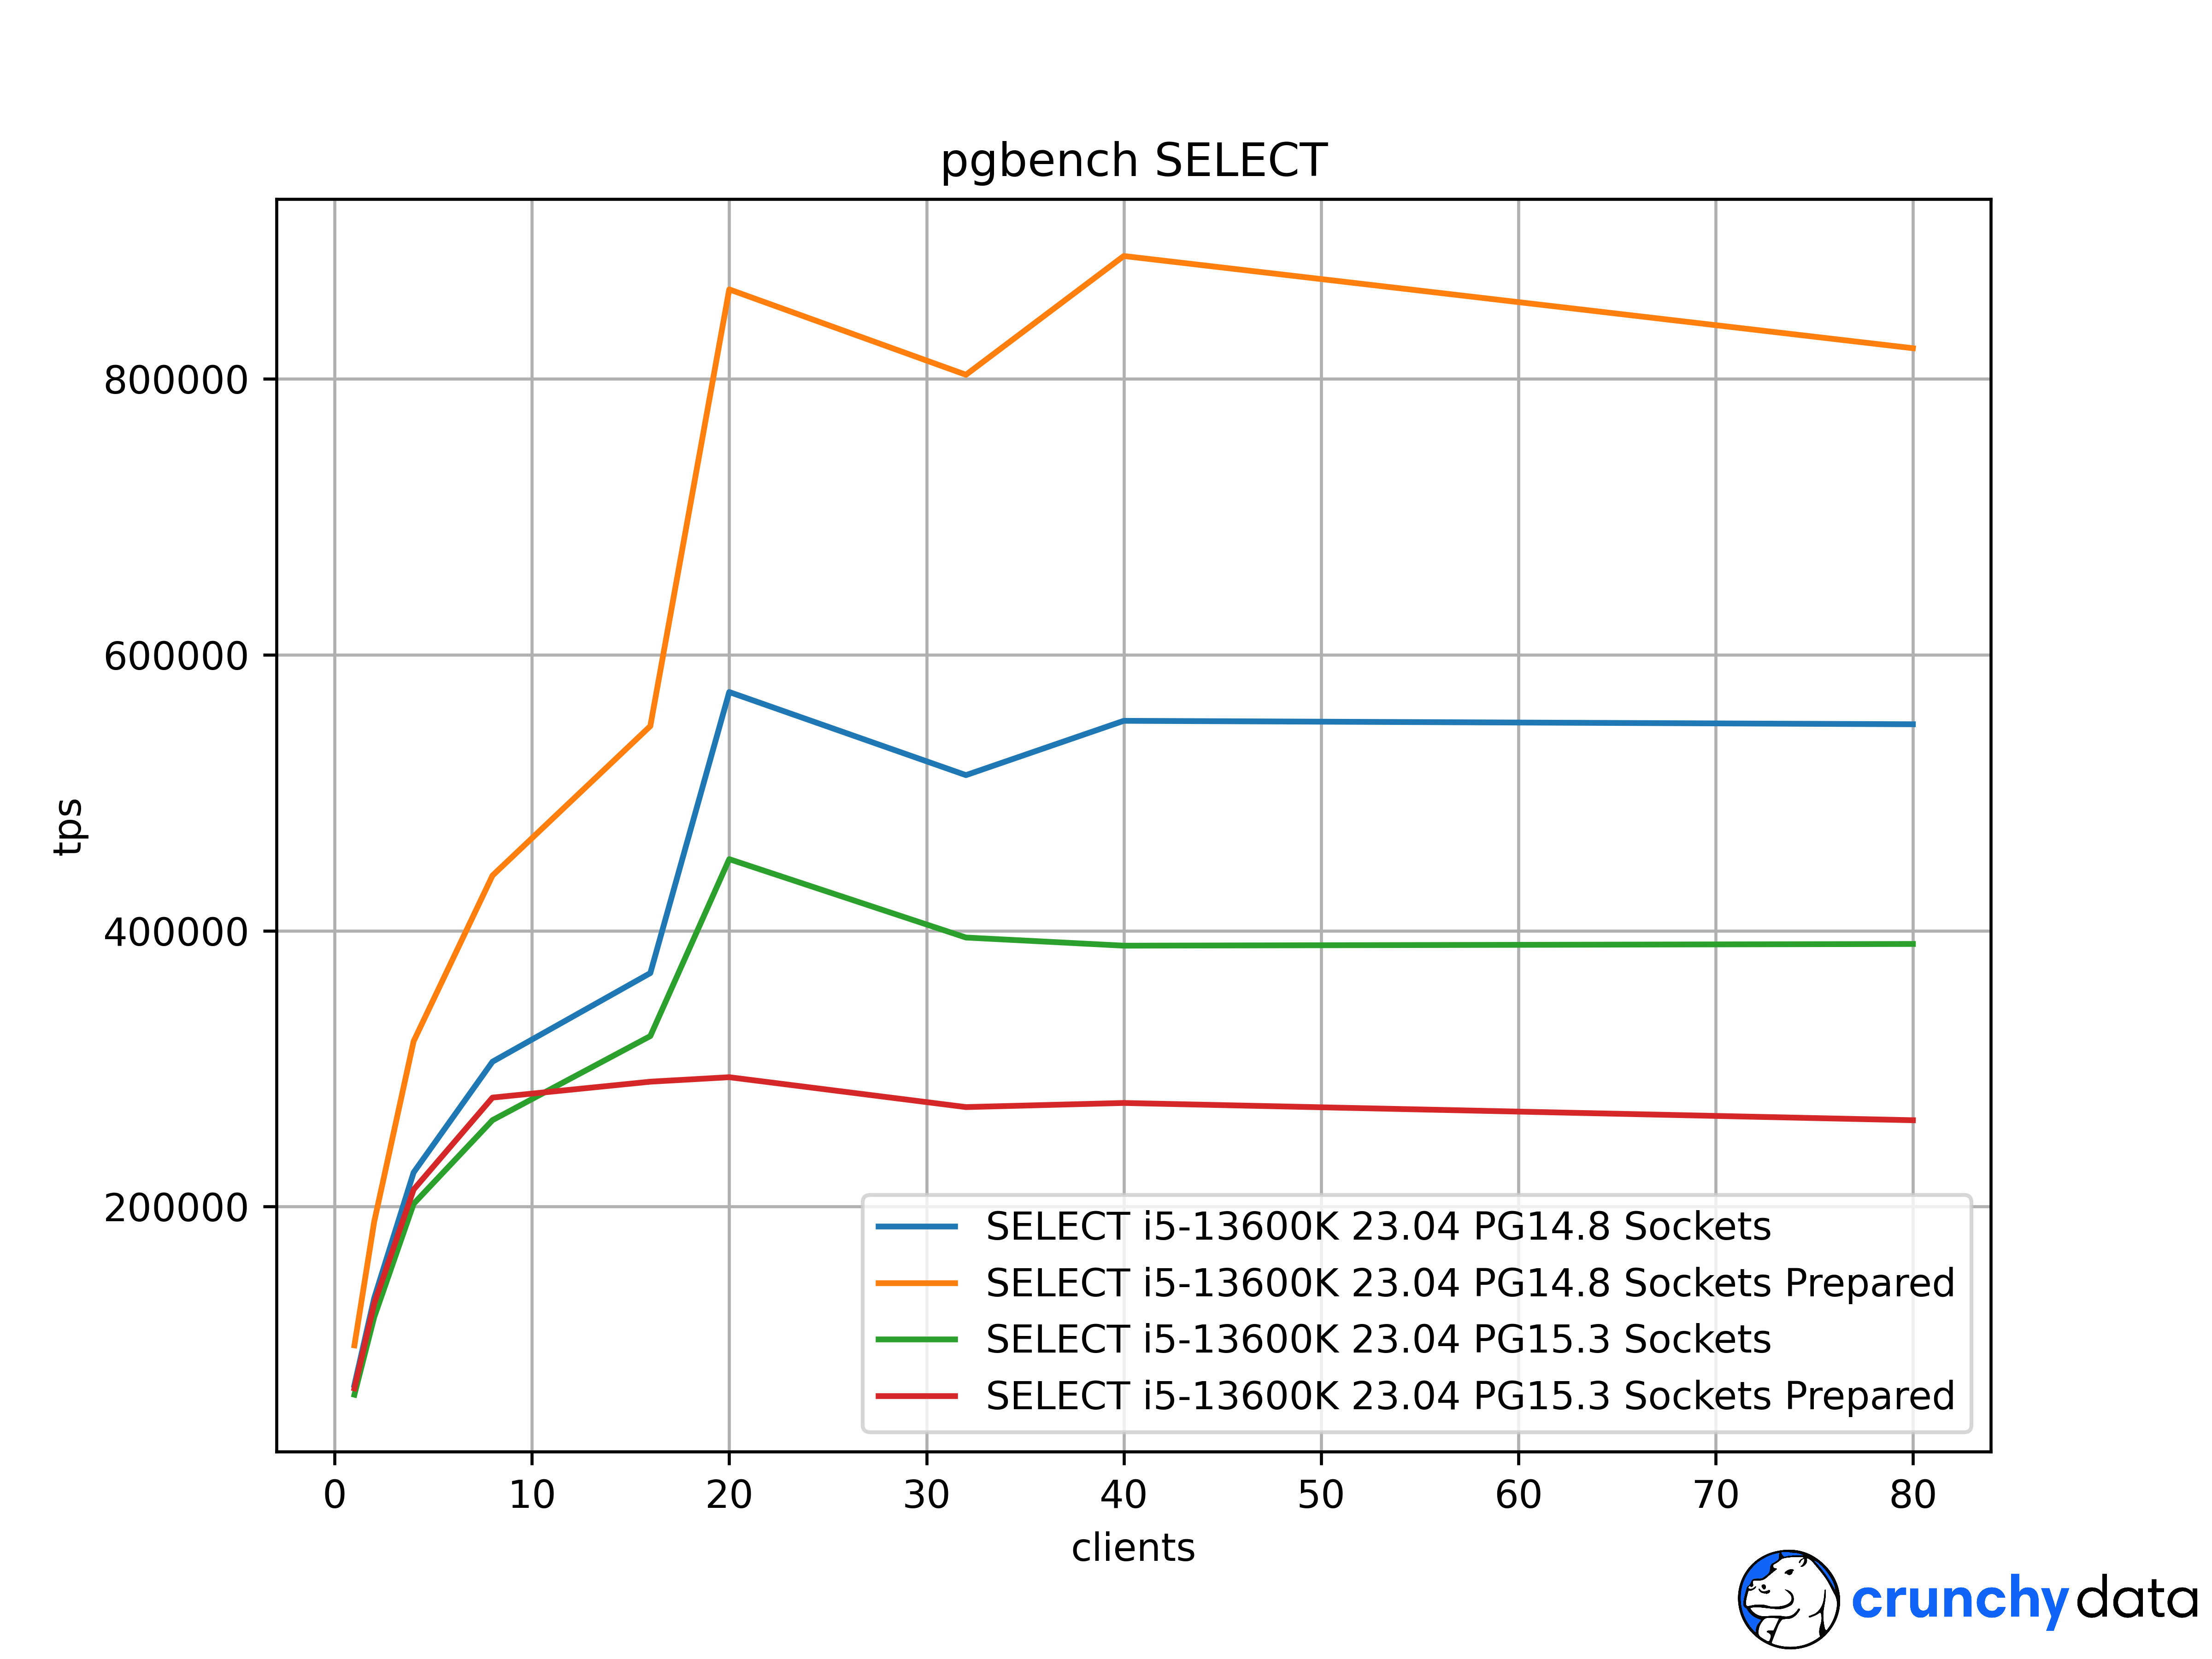
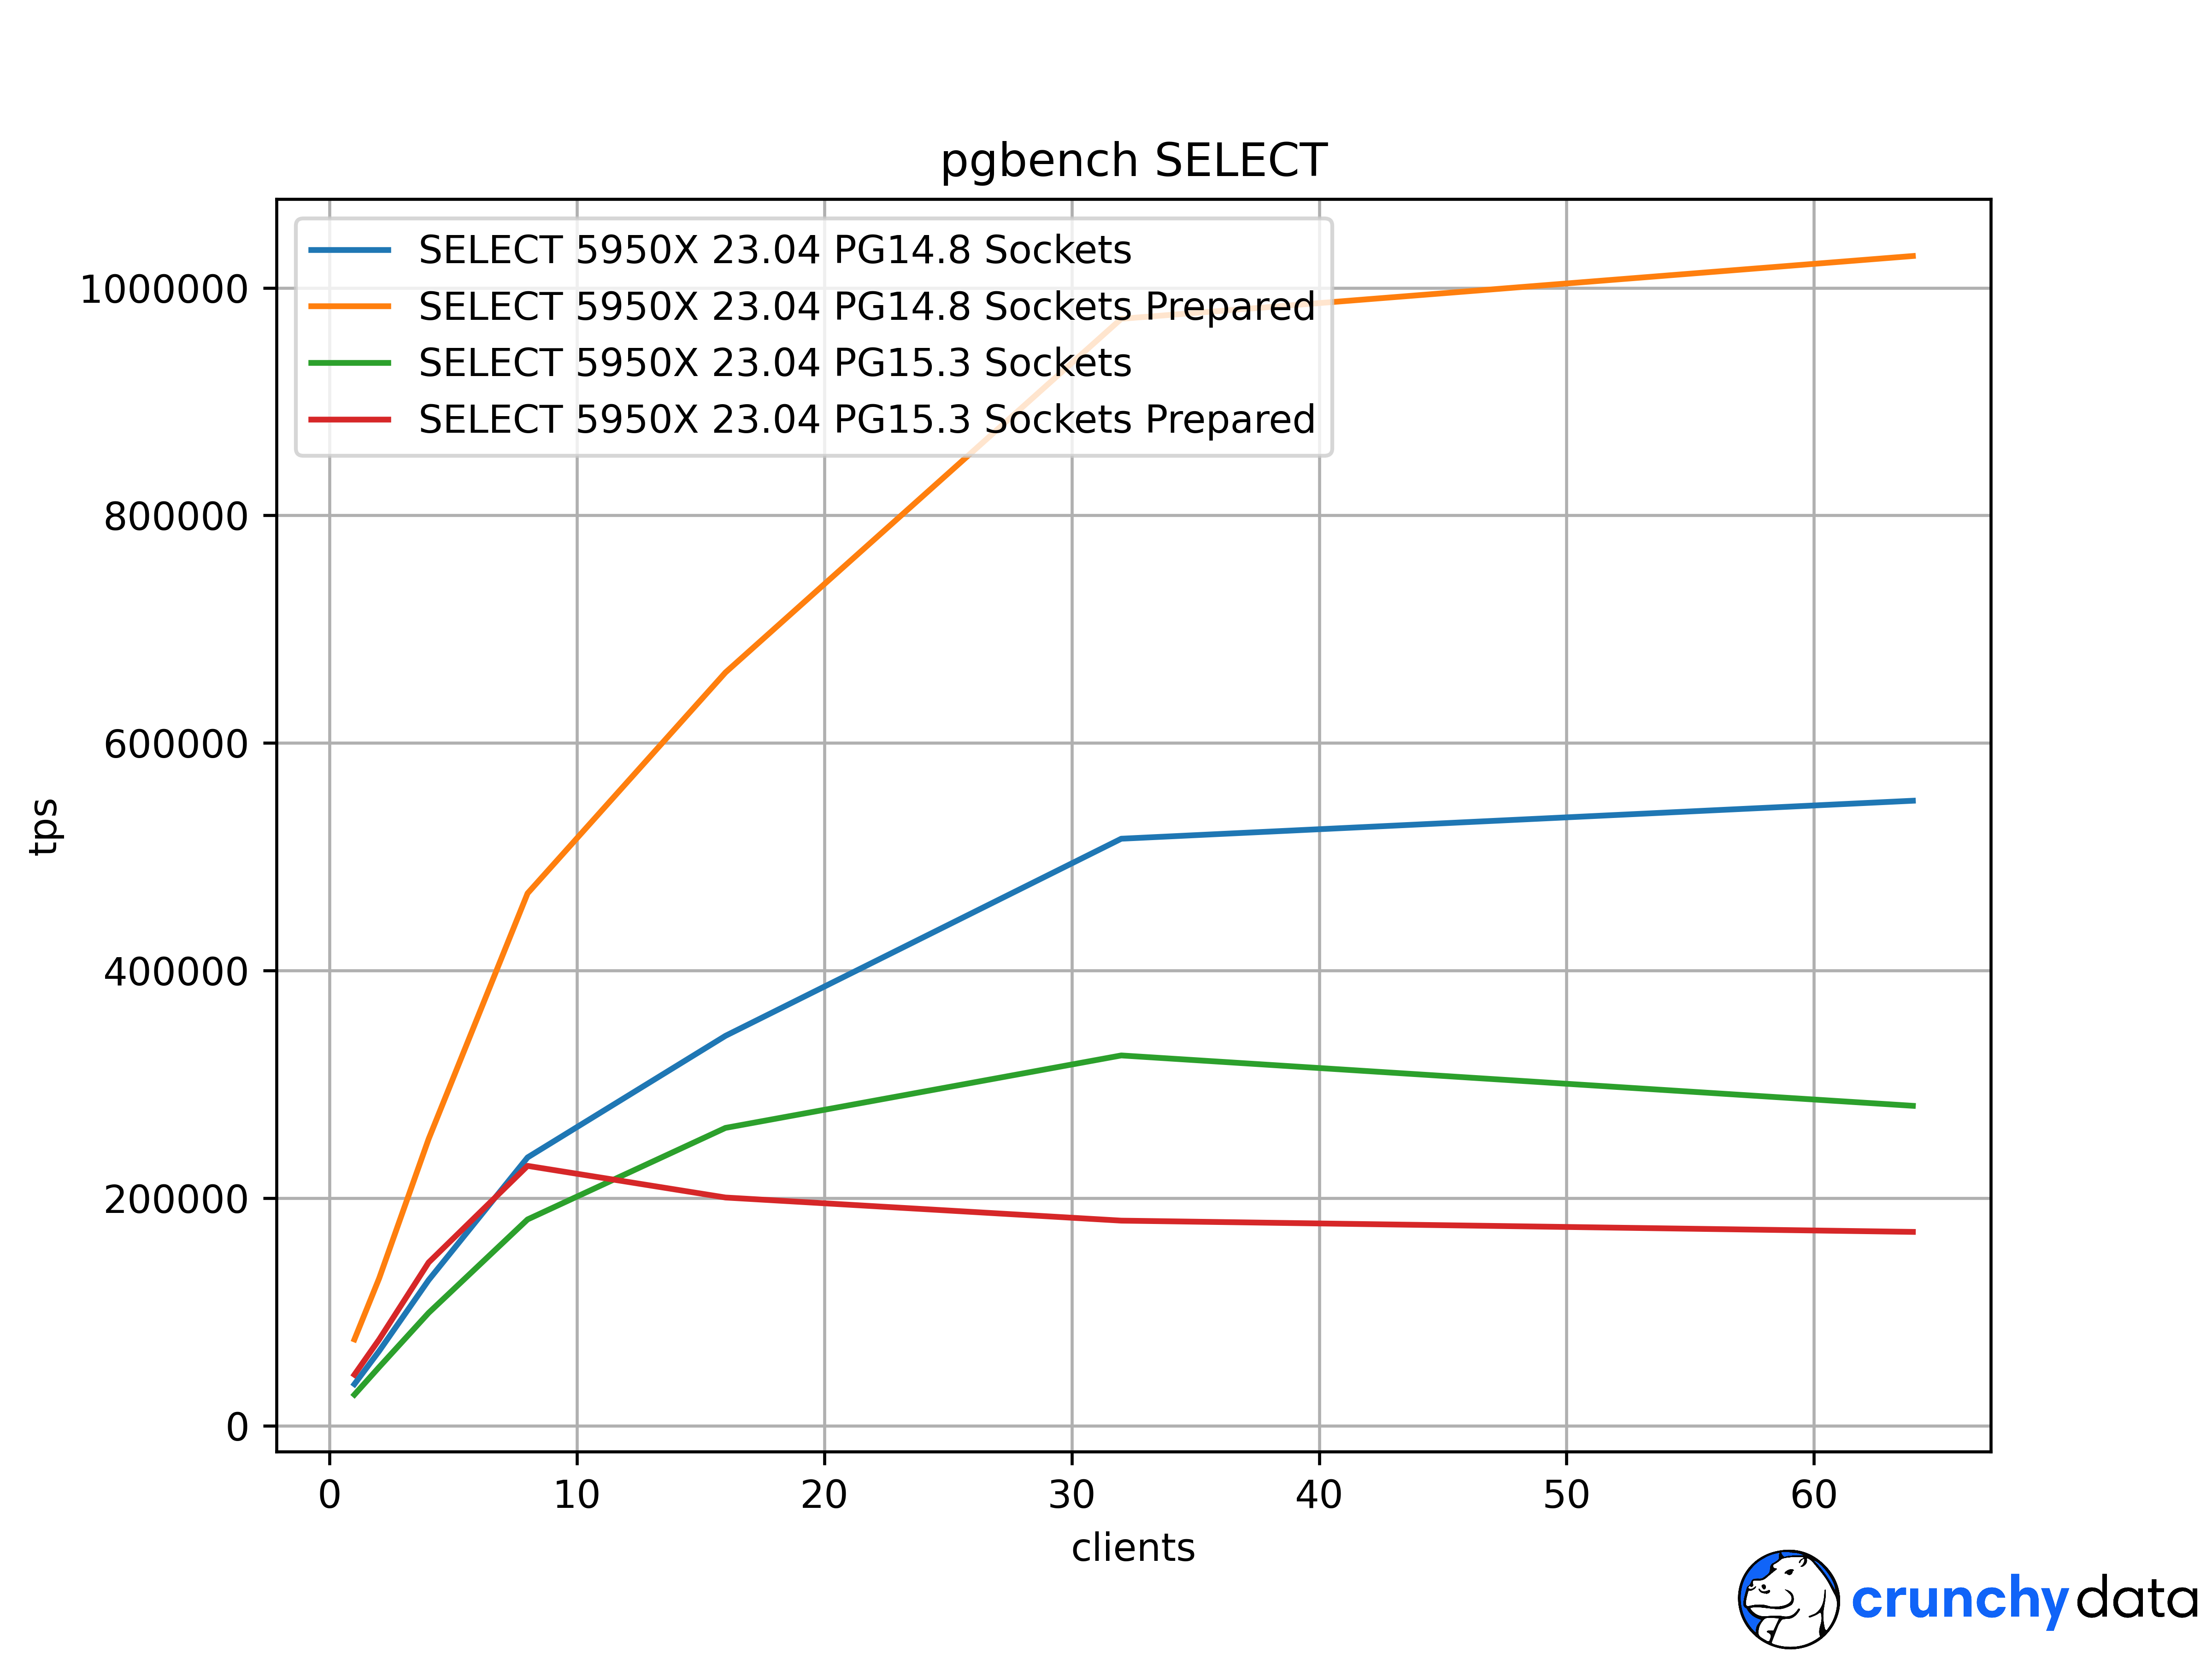
Attached are full scaling graphs for all 4 combinations on this AMD 32 thread 5950X, and an Intel i5-13600K with 20 threads and similar impact. The regular, unprepared sockets peak speeds took a solid hit in PG15 from this issue too. I could use some confirmation of where this happens from other tester's hardware and Linux kernels.
$ pgbench -S -T 10 -c 32 -j 32 -M prepared pgbench
pgbench (15.3 (Ubuntu 15.3-0ubuntu0.23.04.1))
tps = 170952.097609 (without initial connection time)
Overhead Shared Object Symbol
74.34% [kernel] [k] osq_lock
2.26% [kernel] [k] mutex_spin_on_owner
0.40% postgres [.] _bt_compare
0.27% libc.so.6 [.] __dcigettext
0.24% postgres [.] PostgresMain
$ pgbench -S -T 10 -c 32 -j 32 pgbench
pgbench (15.3 (Ubuntu 15.3-0ubuntu0.23.04.1))
tps = 314585.347022 (without initial connection time)
36.24% [kernel] [k] osq_lock
2.73% [kernel] [k] mutex_spin_on_owner
1.41% postgres [.] base_yyparse
0.73% postgres [.] _bt_compare
0.70% postgres [.] hash_search_with_hash_value
0.62% postgres [.] core_yylex
https://lore.kernel.org/linux-mm/202301301057.e55dad5b-oliver.sang@intel.com/
https://lkml.org/lkml/2023/6/6/706
--
Greg Smith greg.smith@crunchydata.com
Director of Open Source Strategy
First round of profile data suggests the lost throughput is going here:
Overhead Shared Object Symbol
74.34% [kernel] [k] osq_lock
2.26% [kernel] [k] mutex_spin_on_owner
While I'd like to just say this is a Linux issue and that's early adopter life with non-LTS Ubuntu releases, that doesn't explain why a PGDG PG14 works perfectly on the same systems?
Quick test to find if you're impacted: on the server and using sockets, run a 10 second SELECT test with/without preparation using 1 or 2 clients/[core|thread] and see if preparation is the slower result. Here's a PGDG PG14 on port 5434 as a baseline, next to Ubuntu 23.04's regular PG15, all using the PG15 pgbench on AMD 5950X:
$ pgbench -i -s 100 pgbench -p 5434
$ pgbench -S -T 10 -c 32 -j 32 -M prepared -p 5434 pgbench
pgbench (14.8 (Ubuntu 14.8-1.pgdg23.04+1))
tps = 1058195.197298 (without initial connection time)
$ pgbench -S -T 10 -c 32 -j 32 -p 5434 pgbench
pgbench (14.8 (Ubuntu 14.8-1.pgdg23.04+1))
tps = 553120.142503 (without initial connection time)
$ pgbench -i -s 100 pgbench
$ pgbench -S -T 10 -c 32 -j 32 -M prepared pgbench
pgbench (15.3 (Ubuntu 15.3-0ubuntu0.23.04.1))
tps = 170952.097609 (without initial connection time)
$ pgbench -S -T 10 -c 32 -j 32 pgbench
pgbench (15.3 (Ubuntu 15.3-0ubuntu0.23.04.1))
tps = 314585.347022 (without initial connection time)
Connecting over sockets with preparation is usually a cheat code that lets newer/bigger processors clear a million TPS like I did here. I don't think that reflects any real use case given the unpopularity of preparation in ORMs, plus needing a local sockets connection to reach top rates.
Attached are full scaling graphs for all 4 combinations on this AMD 32 thread 5950X, and an Intel i5-13600K with 20 threads and similar impact. The regular, unprepared sockets peak speeds took a solid hit in PG15 from this issue too. I could use some confirmation of where this happens from other tester's hardware and Linux kernels.
For completeness sake, peaking at "perf top" shows the hottest code sections for the bad results are:
$ pgbench -S -T 10 -c 32 -j 32 -M prepared pgbench
pgbench (15.3 (Ubuntu 15.3-0ubuntu0.23.04.1))
tps = 170952.097609 (without initial connection time)
Overhead Shared Object Symbol
74.34% [kernel] [k] osq_lock
2.26% [kernel] [k] mutex_spin_on_owner
0.40% postgres [.] _bt_compare
0.27% libc.so.6 [.] __dcigettext
0.24% postgres [.] PostgresMain
$ pgbench -S -T 10 -c 32 -j 32 pgbench
pgbench (15.3 (Ubuntu 15.3-0ubuntu0.23.04.1))
tps = 314585.347022 (without initial connection time)
36.24% [kernel] [k] osq_lock
2.73% [kernel] [k] mutex_spin_on_owner
1.41% postgres [.] base_yyparse
0.73% postgres [.] _bt_compare
0.70% postgres [.] hash_search_with_hash_value
0.62% postgres [.] core_yylex
Here's what good ones look like:
$ pgbench -S -T 10 -c 32 -j 32 -M prepared -p 5434 pgbench
pgbench (14.8 (Ubuntu 14.8-1.pgdg23.04+1))
tps = 1058195.197298 (without initial connection time)
1.42% postgres [.] PostgresMain
1.31% postgres [.] hash_search_with_hash_value
1.08% [kernel] [k] __update_load_avg_se
$ pgbench -S -T 10 -c 32 -j 32 -p 5434 pgbench
pgbench (14.8 (Ubuntu 14.8-1.pgdg23.04+1))
tps = 553120.142503 (without initial connection time)
2.35% postgres [.] base_yyparse
1.37% postgres [.] _bt_compare
1.11% postgres [.] core_yylex
1.09% [kernel] [k] psi_group_change
0.99% postgres [.] hash_search_with_hash_value
There's been plenty of recent chatter on LKML about osq_lock, in January Intel reported a 20% benchmark regression on UnixBench that might be related. Work is still ongoing this week:pgbench (14.8 (Ubuntu 14.8-1.pgdg23.04+1))
tps = 1058195.197298 (without initial connection time)
Overhead Shared Object Symbol
2.37% postgres [.] _bt_compare
2.07% [kernel] [k] psi_group_change
1.42% postgres [.] PostgresMain
1.31% postgres [.] hash_search_with_hash_value
1.08% [kernel] [k] __update_load_avg_se
$ pgbench -S -T 10 -c 32 -j 32 -p 5434 pgbench
pgbench (14.8 (Ubuntu 14.8-1.pgdg23.04+1))
tps = 553120.142503 (without initial connection time)
2.35% postgres [.] base_yyparse
1.37% postgres [.] _bt_compare
1.11% postgres [.] core_yylex
1.09% [kernel] [k] psi_group_change
0.99% postgres [.] hash_search_with_hash_value
https://lore.kernel.org/linux-mm/202301301057.e55dad5b-oliver.sang@intel.com/
https://lkml.org/lkml/2023/6/6/706
Seems time to join that party! Probably going to roll back the Intel system to 22.04 just so I can finish 16b1 tests on schedule on that one. (I only moved to 23.04 to get a major update to AMD's pstate kernel driver, which went great until hitting this test) Also haven't checked yet if the PGDG PG15 is any different from the stock Ubuntu one; wanted to get this report out first.
Greg Smith greg.smith@crunchydata.com
Director of Open Source Strategy
Вложения
Gregory Smith <gregsmithpgsql@gmail.com> writes:
> Pushing SELECT statements at socket speeds with prepared statements is a
> synthetic benchmark that normally demos big pgbench numbers.  My benchmark
> farm moved to Ubuntu 23.04/kernel 6.2.0-20 last month, and that test is
> badly broken on the system PG15 at larger core counts, with as much as an
> 85% drop from expectations.
> ... I could use some confirmation of where this happens from
> other tester's hardware and Linux kernels.

FWIW, I can't reproduce any such effect with PG HEAD on RHEL 8.8
(4.18.0 kernel) or Fedora 37 (6.2.14 kernel).  Admittedly this is
with less-beefy hardware than you're using, but your graphs say
this should be obvious with even a dozen clients, and I don't
see that.  I'm getting results like

$ pgbench -S -T 10 -c 16 -j 16 -M prepared pgbench
tps = 472503.628370 (without initial connection time)
$ pgbench -S -T 10 -c 16 -j 16 pgbench
tps = 297844.301319 (without initial connection time)

which is about what I'd expect.

Could it be that the breakage is Ubuntu-specific?  Seems unlikely,
but ...

            regards, tom lane
On Thu, Jun 8, 2023 at 3:09 PM Gregory Smith <gregsmithpgsql@gmail.com> wrote:
> Pushing SELECT statements at socket speeds with prepared statements is a synthetic benchmark that normally demos big
pgbenchnumbers.  My benchmark farm moved to Ubuntu 23.04/kernel 6.2.0-20 last month, and that test is badly broken on
thesystem PG15 at larger core counts, with as much as an 85% drop from expectations.
> Attached are full scaling graphs for all 4 combinations on this AMD 32 thread 5950X, and an Intel i5-13600K with 20
threadsand similar impact.  The regular, unprepared sockets peak speeds took a solid hit in PG15 from this issue too.
Icould use some confirmation of where this happens from other tester's hardware and Linux kernels.

Since it doesn't look like you included results on pre-23x Ubuntu, I
thought I would reply with my own results using your example. I also
have a 32 thread AMD 5950X but am on Ubuntu 22.10 (kernel 5.19). I did
not see the regression you mention.

HEAD
  pgbench -S -T 10 -c 32 -j 32 -M prepared -p 5432 pgbench
  tps = 837819.220854 (without initial connection time)

  pgbench -S -T 10 -c 32 -j 32 -M simple -p 5432 pgbench
  tps = 576845.930845 (without initial connection time)

REL_15_STABLE
  pgbench -S -T 10 -c 32 -j 32 -M prepared -p 5432 pgbench
  tps = 794380.991666 (without initial connection time)

  pgbench -S -T 10 -c 32 -j 32 -M simple -p 5432 pgbench
  tps = 534358.379838 (without initial connection time)

- Melanie
Hi,

On 2023-06-08 15:08:57 -0400, Gregory Smith wrote:
> Pushing SELECT statements at socket speeds with prepared statements is a
> synthetic benchmark that normally demos big pgbench numbers.  My benchmark
> farm moved to Ubuntu 23.04/kernel 6.2.0-20 last month, and that test is
> badly broken on the system PG15 at larger core counts, with as much as an
> 85% drop from expectations.  Since this is really just a benchmark workload
> the user impact is very narrow, probably zero really, but as the severity
> of the problem is high we should get to the bottom of what's going on.


> First round of profile data suggests the lost throughput is going here:
> Overhead  Shared Object          Symbol
>   74.34%  [kernel]               [k] osq_lock
>    2.26%  [kernel]               [k] mutex_spin_on_owner

Could you get a profile with call graphs? We need to know what leads to all
those osq_lock calls.

perf record --call-graph dwarf -a sleep 1

or such should do the trick, if run while the workload is running.


> Quick test to find if you're impacted:  on the server and using sockets,
> run a 10 second SELECT test with/without preparation using 1 or 2
> clients/[core|thread] and see if preparation is the slower result.  Here's
> a PGDG PG14 on port 5434 as a baseline, next to Ubuntu 23.04's regular
> PG15, all using the PG15 pgbench on AMD 5950X:

I think it's unwise to compare builds of such different vintage. The compiler
options and compiler version can have substantial effects.


> $ pgbench -i -s 100 pgbench -p 5434
> $ pgbench -S -T 10 -c 32 -j 32 -M prepared -p 5434 pgbench
> pgbench (14.8 (Ubuntu 14.8-1.pgdg23.04+1))
> tps = 1058195.197298 (without initial connection time)

I recommend also using -P1. Particularly when using unix sockets, the
specifics of how client threads and server threads are scheduled plays a huge
role. How large a role can change significantly between runs and between
fairly minor changes to how things are executed (e.g. between major PG
versions).

E.g. on my workstation (two sockets, 10 cores/20 threads each), with 32
clients, performance changes back and forth between ~600k and ~850k. Whereas
with 42 clients, it's steadily at 1.1M, with little variance.

I also have seen very odd behaviour on larger machines when
/proc/sys/kernel/sched_autogroup_enabled is set to 1.


> There's been plenty of recent chatter on LKML about *osq_lock*, in January
> Intel reported a 20% benchmark regression on UnixBench that might be
> related.  Work is still ongoing this week:

I've seen such issues in the past, primarily due to contention internal to
cgroups, when the memory controller is enabled.  IIRC that could be alleviated
to a substantial degree with cgroup.memory=nokmem.

Greetings,

Andres Freund
Hi,

On 2023-06-08 15:18:07 -0700, Andres Freund wrote:
> E.g. on my workstation (two sockets, 10 cores/20 threads each), with 32
> clients, performance changes back and forth between ~600k and ~850k. Whereas
> with 42 clients, it's steadily at 1.1M, with little variance.

FWIW, this is with linux 6.2.12, compiled by myself though.

Greetings,

Andres Freund
On Thu, Jun 8, 2023 at 6:18 PM Andres Freund <andres@anarazel.de> wrote:
Could you get a profile with call graphs? We need to know what leads to all
those osq_lock calls.
perf record --call-graph dwarf -a sleep 1
or such should do the trick, if run while the workload is running.
I'm doing something wrong because I can't find the slow part in the perf data; I'll get back to you on this one.
I think it's unwise to compare builds of such different vintage. The compiler
options and compiler version can have substantial effects.
I recommend also using -P1. Particularly when using unix sockets, the
specifics of how client threads and server threads are scheduled plays a huge
role.
Fair suggestions, those graphs come out of pgbench-tools where I profile all the latency, fast results for me are ruler flat. It's taken me several generations of water cooling experiments to reach that point, but even that only buys me 10 seconds before I can overload a CPU to higher latency with tougher workloads. Here's a few seconds of slightly updated examples, now with matching PGDG sourced 14+15 on the 5950X and with sched_autogroup_enabled=0 too:
$ pgbench -S -T 10 -c 32 -j 32 -M prepared -p 5434 -P 1 pgbench
pgbench (14.8 (Ubuntu 14.8-1.pgdg23.04+1))
progress: 1.0 s, 1032929.3 tps, lat 0.031 ms stddev 0.004
progress: 2.0 s, 1051239.0 tps, lat 0.030 ms stddev 0.001
progress: 3.0 s, 1047528.9 tps, lat 0.030 ms stddev 0.008...
$ pgbench -S -T 10 -c 32 -j 32 -M prepared -p 5432 -P 1 pgbench
pgbench (15.3 (Ubuntu 15.3-1.pgdg23.04+1))
progress: 1.0 s, 171816.4 tps, lat 0.184 ms stddev 0.029, 0 failed
progress: 2.0 s, 173501.0 tps, lat 0.184 ms stddev 0.024, 0 failed...
On the slow runs it will even do this, watch my 5950X accomplish 0 TPS for a second!
progress: 38.0 s, 177376.9 tps, lat 0.180 ms stddev 0.039, 0 failed
progress: 39.0 s, 35861.5 tps, lat 0.181 ms stddev 0.032, 0 failed
progress: 40.0 s, 0.0 tps, lat 0.000 ms stddev 0.000, 0 failed
progress: 41.0 s, 222.1 tps, lat 304.500 ms stddev 741.413, 0 failed
progress: 42.0 s, 101199.6 tps, lat 0.530 ms stddev 18.862, 0 failed
progress: 43.0 s, 98286.9 tps, lat 0.328 ms stddev 8.156, 0 failed
Gonna have to measure seconds/transaction if this gets any worse.
I've seen such issues in the past, primarily due to contention internal to
cgroups, when the memory controller is enabled. IIRC that could be alleviated
to a substantial degree with cgroup.memory=nokmem.
I cannot express on-list how much I dislike everything about the cgroups code. Let me dig up the right call graph data first and will know more then. The thing that keeps me from chasing kernel tuning too hard is seeing the PG14 go perfectly every time. This is a really weird one. All the suggestions much appreciated.
Hi,

On 2023-06-08 20:20:18 -0400, Gregory Smith wrote:
> On Thu, Jun 8, 2023 at 6:18 PM Andres Freund <andres@anarazel.de> wrote:
>
> > Could you get a profile with call graphs? We need to know what leads to all
> > those osq_lock calls.
> > perf record --call-graph dwarf -a sleep 1
> > or such should do the trick, if run while the workload is running.
> >
>
> I'm doing something wrong because I can't find the slow part in the perf
> data; I'll get back to you on this one.

You might need to add --no-children to the perf report invocation, otherwise
it'll show you the call graph inverted.

- Andres
Let me start with the happy ending to this thread:
$ pgbench -S -T 10 -c 32 -j 32 -M prepared -P 1 pgbench
On Thu, Jun 8, 2023 at 9:21 PM Andres Freund <andres@anarazel.de> wrote:
pgbench (15.3 (Ubuntu 15.3-1.pgdg23.04+1))
progress: 1.0 s, 1015713.0 tps, lat 0.031 ms stddev 0.007, 0 failed
progress: 2.0 s, 1083780.4 tps, lat 0.029 ms stddev 0.007, 0 failed...
progress: 8.0 s, 1084574.1 tps, lat 0.029 ms stddev 0.001, 0 failed
progress: 9.0 s, 1082665.1 tps, lat 0.029 ms stddev 0.001, 0 failed
progress: 1.0 s, 1015713.0 tps, lat 0.031 ms stddev 0.007, 0 failed
progress: 2.0 s, 1083780.4 tps, lat 0.029 ms stddev 0.007, 0 failed...
progress: 8.0 s, 1084574.1 tps, lat 0.029 ms stddev 0.001, 0 failed
progress: 9.0 s, 1082665.1 tps, lat 0.029 ms stddev 0.001, 0 failed
tps = 1077739.910163 (without initial connection time)
Which even seems a whole 0.9% faster than 14 on this hardware! The wonders never cease.
You might need to add --no-children to the perf report invocation, otherwise
it'll show you the call graph inverted.
My problem was not writing kernel symbols out, I was only getting addresses for some reason. This worked:
sudo perf record -g --call-graph dwarf -d --phys-data -a sleep 1
perf report --stdio
And once I looked at the stack trace I immediately saw the problem, fixed the config option, and this report is now closed as PEBKAC on my part. Somehow I didn't notice the 15 installs on both systems had log_min_duration_statement=0, and that's why the performance kept dropping *only* on the fastest runs.
What I've learned today then is that if someone sees osq_lock in simple perf top out on oddly slow server, it's possible they are overloading a device writing out log file data, and leaving out the boring parts the call trace you might see is:
EmitErrorReport
__GI___libc_write
ksys_write
__fdget_pos
mutex_lock
__mutex_lock_slowpath
__mutex_lock.constprop.0
71.20% osq_lock
__GI___libc_write
ksys_write
__fdget_pos
mutex_lock
__mutex_lock_slowpath
__mutex_lock.constprop.0
71.20% osq_lock
Everyone was stuck trying to find the end of the log file to write to it, and that was the entirety of the problem. Hope that call trace and info helps out some future goofball making the same mistake. I'd wager this will come up again.
On Fri, Jun 9, 2023 at 12:28 AM Gregory Smith <gregsmithpgsql@gmail.com> wrote:
>
> Let me start with the happy ending to this thread:

Phew! I'm sure everyone would be relieved to know this was a false alarm.

> On Thu, Jun 8, 2023 at 9:21 PM Andres Freund <andres@anarazel.de> wrote:
>>
>> You might need to add --no-children to the perf report invocation, otherwise
>> it'll show you the call graph inverted.
>
>
> My problem was not writing kernel symbols out, I was only getting addresses for some reason.  This worked:
>
>   sudo perf record -g --call-graph dwarf -d --phys-data -a sleep 1
>   perf report --stdio

There is no mention of perf or similar utilities in pgbench-tools
docs. I'm guessing Linux is the primary platform pgbench-tools gets
used on most. If so, I think it'd be useful to mention these tools and
snippets in there to make others lives easier, when they find
themselves scratching heads.

Best regards,
Gurjeet
http://Gurje.et
On Fri, Jun 9, 2023 at 4:06 AM Gurjeet Singh <gurjeet@singh.im> wrote:
There is no mention of perf or similar utilities in pgbench-tools
docs. I'm guessing Linux is the primary platform pgbench-tools gets
used on most. If so, I think it'd be useful to mention these tools and
snippets in there to make others lives easier.
I haven't been aggressive about pushing perf because a lot of customers at Crunchy--a disproportionately larger number than typical I suspect--have operations restrictions that just don't allow DBAs direct access to a server's command line. So perf commands are just out of reach before we even get to the permissions it requires. I may have to do something really wild to help them, like see if the right permissions setup would allow PL/python3 or similar to orchestrate a perf session in a SQL function.
On Fri, Jun 9, 2023 at 3:28 AM Gregory Smith <gregsmithpgsql@gmail.com> wrote:
> On Thu, Jun 8, 2023 at 9:21 PM Andres Freund <andres@anarazel.de> wrote:
>>
>> You might need to add --no-children to the perf report invocation, otherwise
>> it'll show you the call graph inverted.
>
>
> My problem was not writing kernel symbols out, I was only getting addresses for some reason.  This worked:
>
>   sudo perf record -g --call-graph dwarf -d --phys-data -a sleep 1
>   perf report --stdio

Do you know why using phys-data would have solved the problem in your
particular setup? I find figuring out what perf options I need
mystifying.
I end up trying random things from
https://wiki.postgresql.org/wiki/Profiling_with_perf,  the perf man
page, and https://www.brendangregg.com/perf.html

The pg wiki page actually has a lot of detail. If you think your
particular problem is something others would encounter, it could be
good to add it there.

FWIW, I think it is helpful to have hackers threads like this where
people work through unexplained performance results with others in the
community.

- Melanie