Re: PATCH: RM #4778 - Query Plan Analyser
| От | Akshay Joshi |
|---|---|
| Тема | Re: PATCH: RM #4778 - Query Plan Analyser |
| Дата | |
| Msg-id | CANxoLDfuoo7MzGzQ=sHHbdxkfE8gWUewP-yWvb=HwLOfp5VtDQ@mail.gmail.com обсуждение исходный текст |
| Ответ на | Re: PATCH: RM #4778 - Query Plan Analyser (Ashesh Vashi <ashesh.vashi@enterprisedb.com>) |
| Ответы |
Re: PATCH: RM #4778 - Query Plan Analyser
Re: PATCH: RM #4778 - Query Plan Analyser |
| Список | pgadmin-hackers |
Hi Ashesh
I have fixed the following issues:
Following are the review comments:
- Function 'decimalAdjust' should be defined in utils.js instead of pgadmin.js
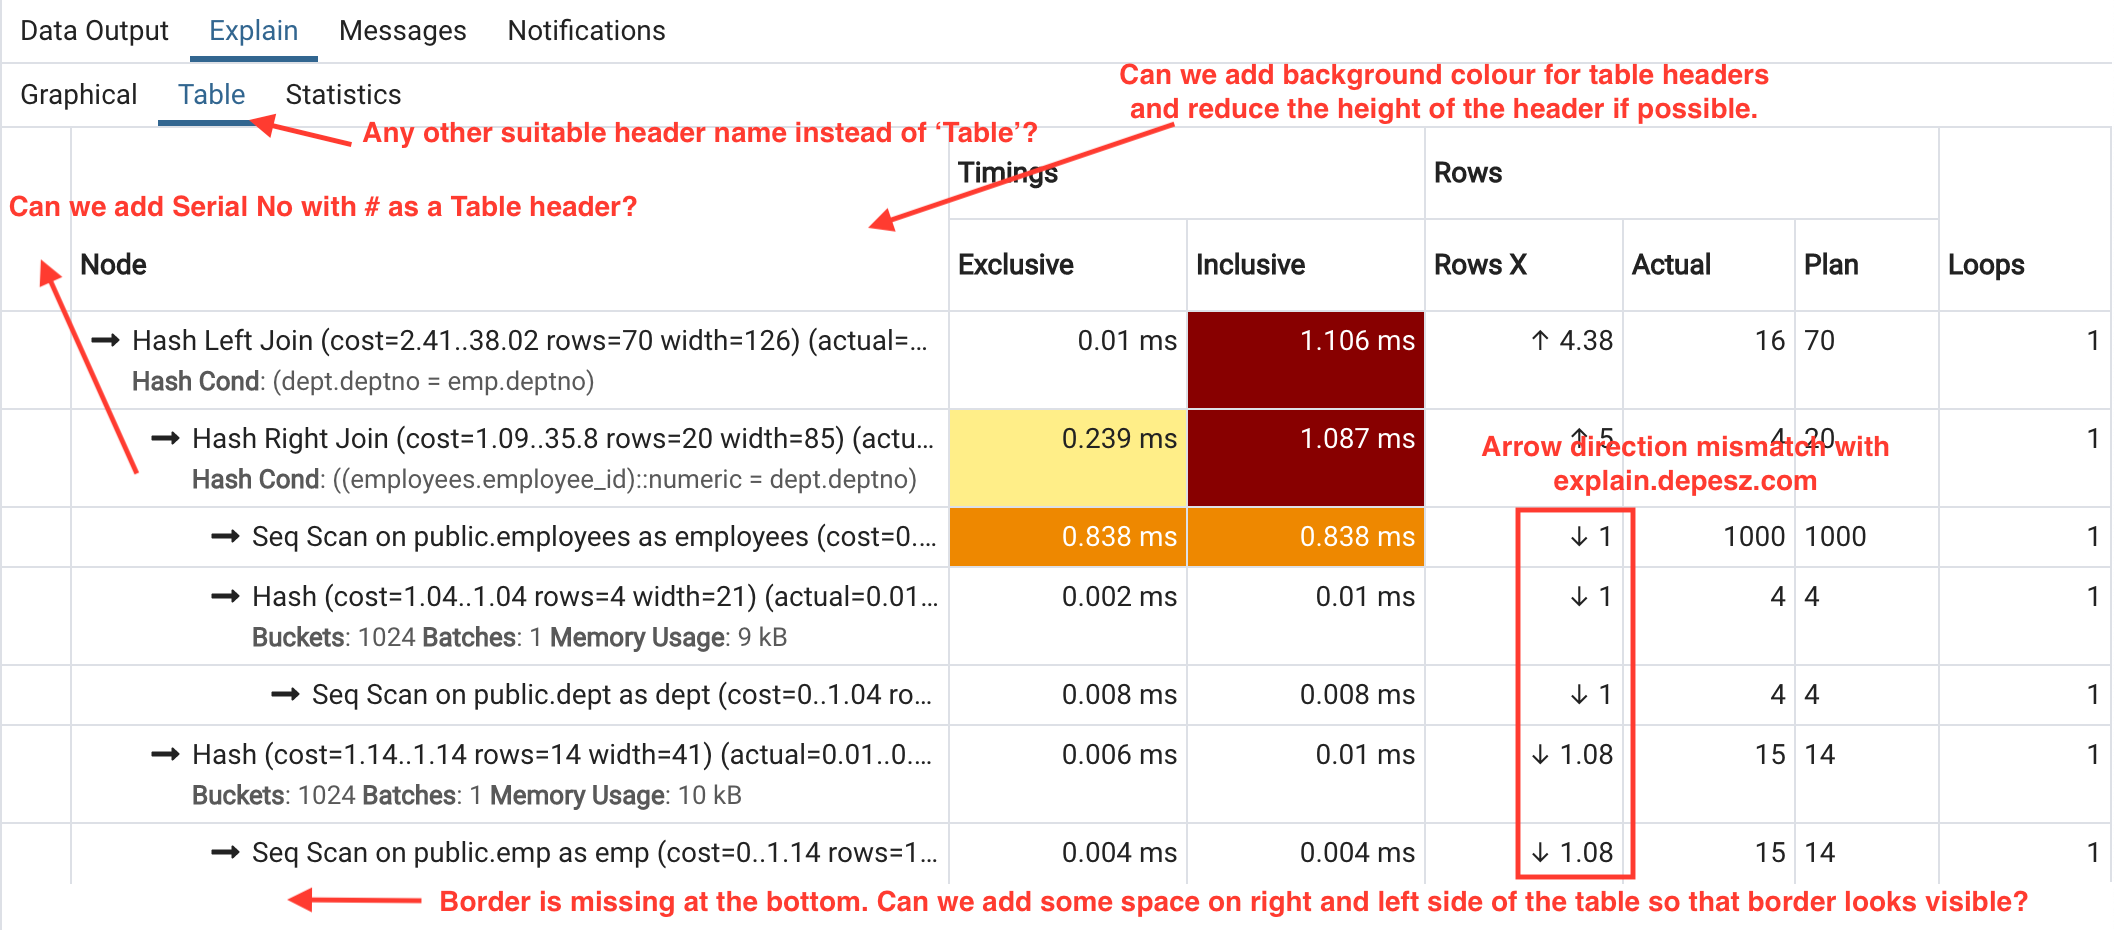
- A couple of GUI related comment, please check the below two images.
- Some minor linter errors.
- Updated wordings in the documentation and remove the comma used before 'or/and' word.
- In '_explain.scss' file 'lightgray' color replaced by $color-gray-lighter.
Attached is the modified patch. Please take a look at it.
On Thu, Oct 3, 2019 at 8:47 PM Ashesh Vashi <ashesh.vashi@enterprisedb.com> wrote:
On Thu, Oct 3, 2019 at 5:01 PM Ashesh Vashi <ashesh.vashi@enterprisedb.com> wrote:On Thu, Oct 3, 2019 at 4:54 PM Ashesh Vashi <ashesh.vashi@enterprisedb.com> wrote:Hi Team,
I've implemented the query plan analyzer having similar functionality as explain.depsez.com.
It now creates three tabs under the 'Explain' panel.
Graphical
-> Graphical Explain Plan
Table (similar to explain.depsez.com)
-> Table to analyse the plan in details.
-> Each row represents the statistics per Explain Node
-> It may contains columns like node information, exclusive timing (time spent for this explain node excluding the child nodes), inclusive timing, actual rows, plan rows, rowsx (misestimation between planned vs actual rows), loop
-> Background color of exclusive, inclusive, rows changes based on their values.
i.e.
if Percentage of exclusive, and inclusive timings of total query time is
> 90 - Red Color
> 50 - Orange (Between Red & Yellow Color)
> 10 - Yellow color
if planner misestimation for the rows is
> 1000 times - Red Color
> 100 times - Orange (Between Red & Yellow Color)
> 10 times - Yellow Color
Also - if actual rows >= plan rows then it shows up arrow, , else it shows down arrow.
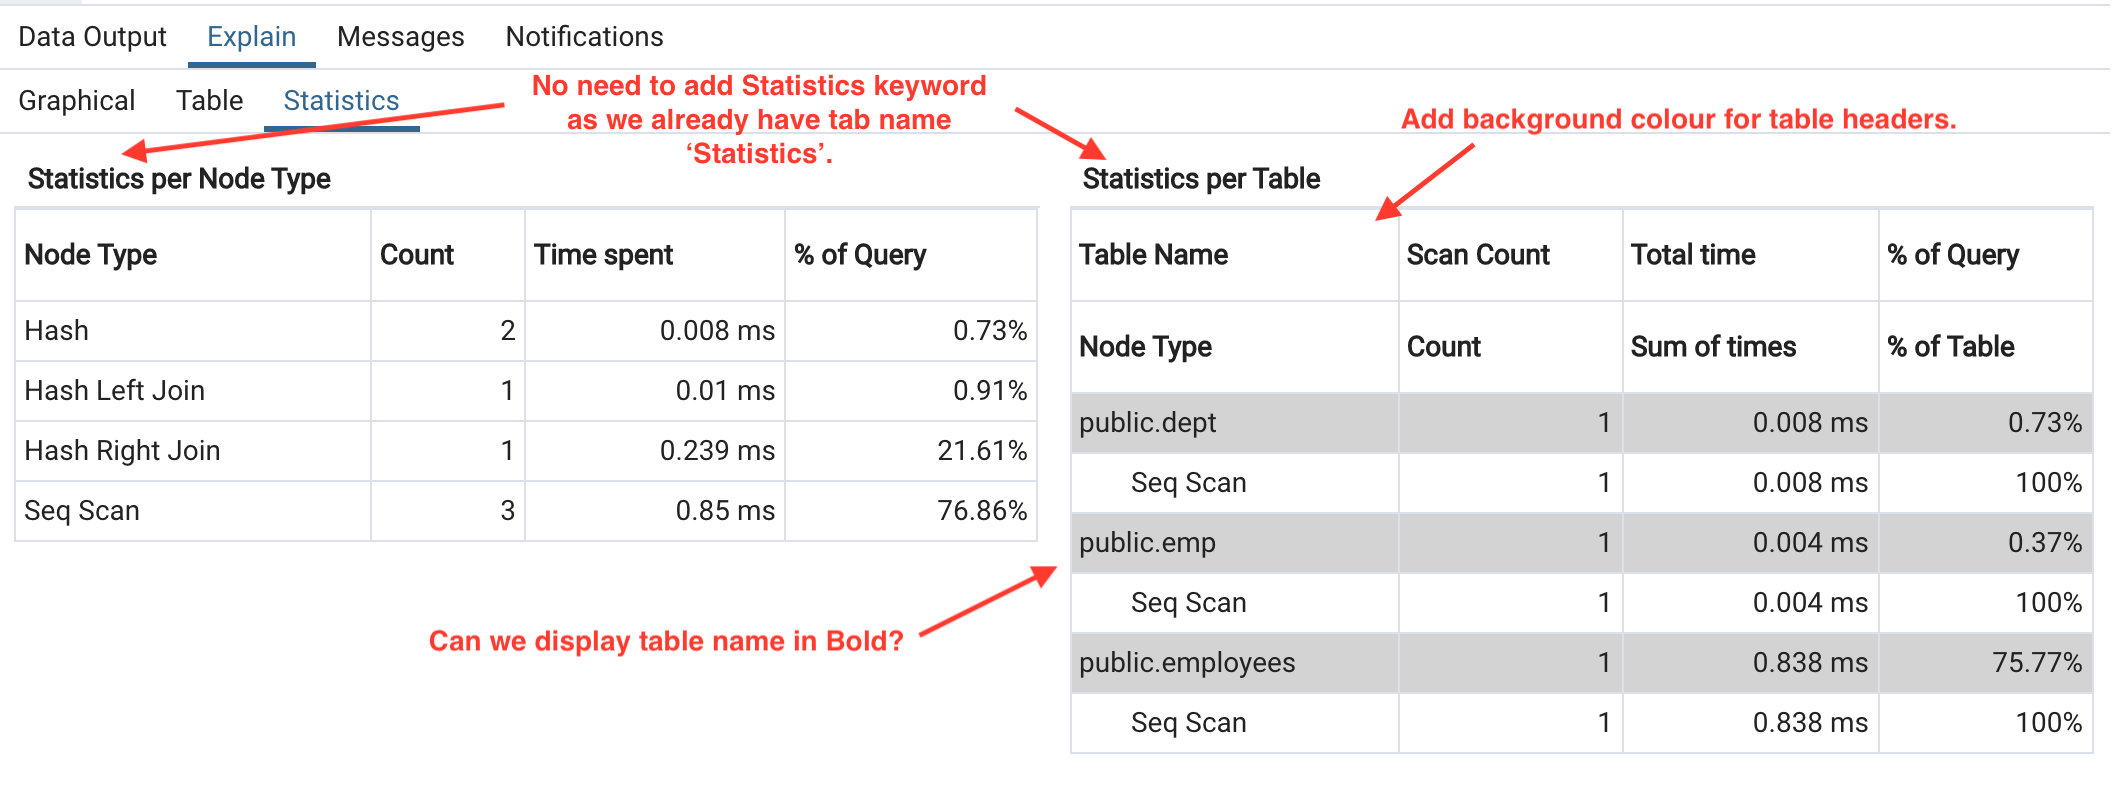
Statistics
-> It contains a HTML table for the statistics per Node Type, and a HTML table for the statistics per table.
Please review it.Please find the patch for the same.Please find the updated patch after fixing two issues in statistics panel:
- Percentage was calculated based on 'Actual Total Time', which is inclusive time, and was giving wrong results.
- Count column values should be right aligned.-- Ashesh-- Ashesh
Thanks & Regards
Akshay Joshi
Sr. Software Architect
EnterpriseDB Software India Private Limited
Mobile: +91 976-788-8246
Вложения
В списке pgadmin-hackers по дате отправления: