Re: BUG #17974: Walsenders memory usage suddenly spike to 80G+ causing OOM and server reboot
| От | Michael Guissine |
|---|---|
| Тема | Re: BUG #17974: Walsenders memory usage suddenly spike to 80G+ causing OOM and server reboot |
| Дата | |
| Msg-id | CACxDrAkywDL2y5DyLL9fxDzPhKUFBaCZ9D2gkP7OzQsd7GQXng@mail.gmail.com обсуждение исходный текст |
| Ответ на | Re: BUG #17974: Walsenders memory usage suddenly spike to 80G+ causing OOM and server reboot (Andres Freund <andres@anarazel.de>) |
| Ответы |
Re: BUG #17974: Walsenders memory usage suddenly spike to 80G+ causing OOM and server reboot
|
| Список | pgsql-bugs |
Thanks Andres, see below
On Wed, Jun 14, 2023 at 6:15 PM Andres Freund <andres@anarazel.de> wrote:
Hi,
On 2023-06-14 10:23:32 +0900, Michael Paquier wrote:
> On Wed, Jun 14, 2023 at 12:05:32AM +0000, PG Bug reporting form wrote:
> > We are running relatively large and busy Postgres database on RDS and using
> > logical replication extensively. We currently have 7 walsenders and while we
> > often see replication falls behind due to high transactional volume, we've
> > never experienced memory issues in 14.6 and below. After recent upgrade to
> > 14.8, we already had several incidents where walsender processes RES memory
> > would suddenly increase to over 80GB each causing freeable memory on the
> > instance to go down to zero.
When postgres knows it ran out of memory (instead of having gotten killed by
the OOM killer), it'll dump memory context information to the log. Could you
check whether there are related log entries? They should precede an "out of
memory" ERROR.
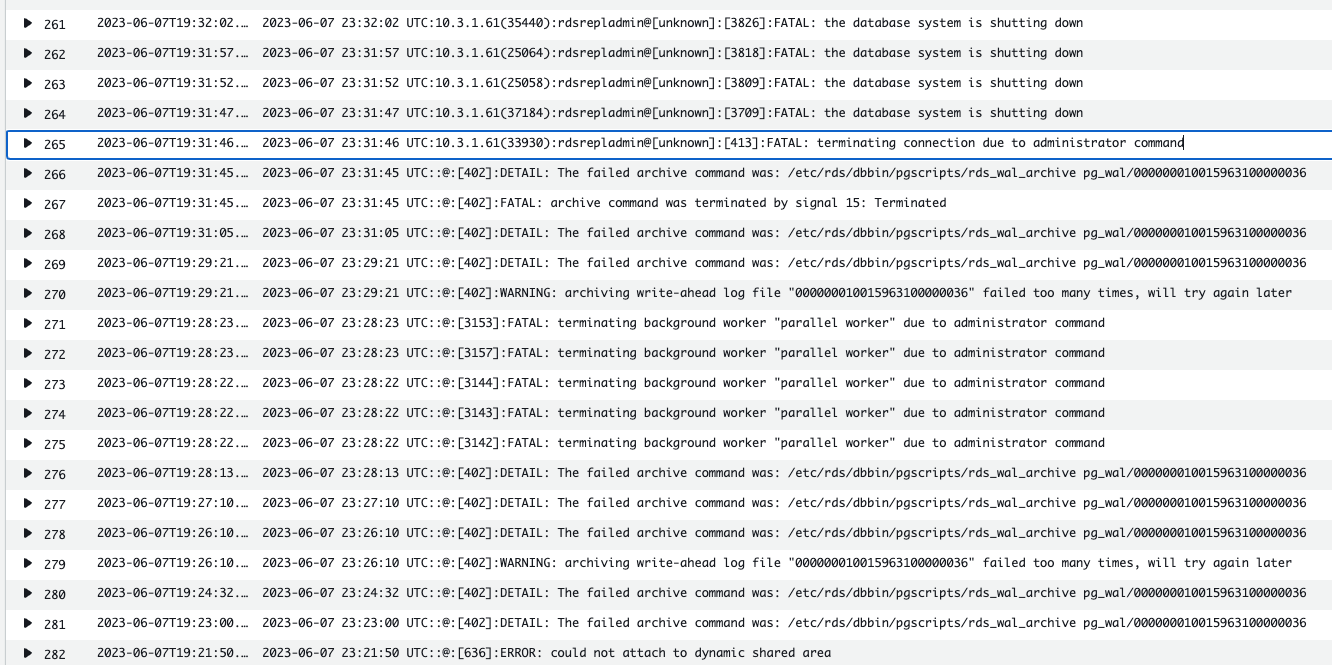
There are no "out of memory errors" in the logs, the RDS instance was restarted by AWS in response to the memory issues on the host (most likely). This is all I see in the RDS logs at the time of the failure
There was sudden freeable memory drop prior to the incident
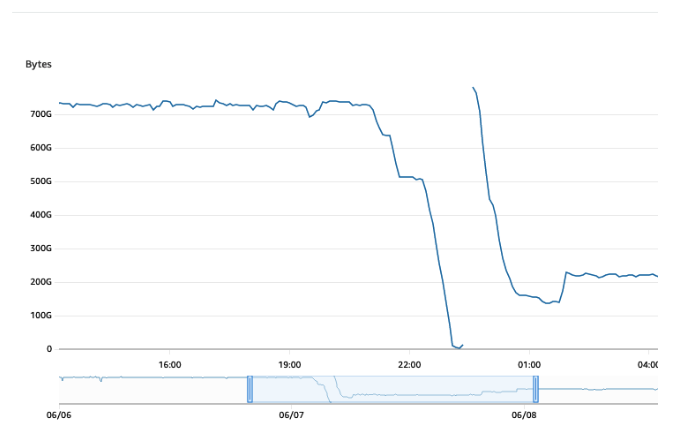
note that after restart, the memory didn't fully recovered even though we had everything stopped except the logical replication
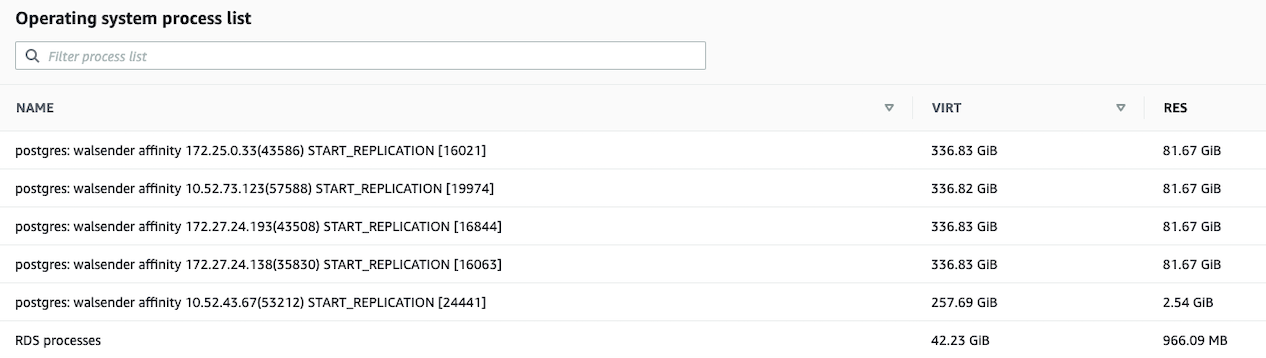
this is a view into processes list after the instance has recovered, showing that walsenders are still holding to 80GB+ of res memory
> > Interesting that even after Instance reboot,
> > the memory used by walsender processes won't get released until we restart
> > the replication and drop the logical slots. The logical_decoding_work_mem
> > was set to 512MB in time of the last incident but we recently lowered it to
> > 128MB.
That seems very unlikely to be the case. If you restarted postgres or postgres
and the OS, there's nothing to have allocated the memory. What exactly do you
mean by "Instance reboot"?
By instance reboot I meant AWS terminating postgres process and restarting
> > Any known issues in pg 14.8 that would trigger this behaviour?
>
> Yes, there are known issues with memory handling in logical
> replication setups. See for example this thread:
> https://www.postgresql.org/message-id/CAMnUB3oYugXCBLSkih+qNsWQPciEwos6g_AMbnz_peNoxfHwyw@mail.gmail.com
Why would 14.8 have made that problem worse?
This is an assumption obviously, based on the fact that we have been running this database for several years already and haven't seen similar memory issues until the recent upgrade to 14.8.
Greetings,
Andres Freund
Вложения
В списке pgsql-bugs по дате отправления: