Re: Overhead cost of Serializable Snapshot Isolation
| От | Robert Haas |
|---|---|
| Тема | Re: Overhead cost of Serializable Snapshot Isolation |
| Дата | |
| Msg-id | CA+TgmoZog1wFbyrqzJUkiLSXw5sDUjJGUeY0c2BqSG-tciSB7w@mail.gmail.com обсуждение исходный текст |
| Ответ на | Re: Overhead cost of Serializable Snapshot Isolation ("Kevin Grittner" <Kevin.Grittner@wicourts.gov>) |
| Ответы |
Re: Overhead cost of Serializable Snapshot Isolation
|
| Список | pgsql-hackers |
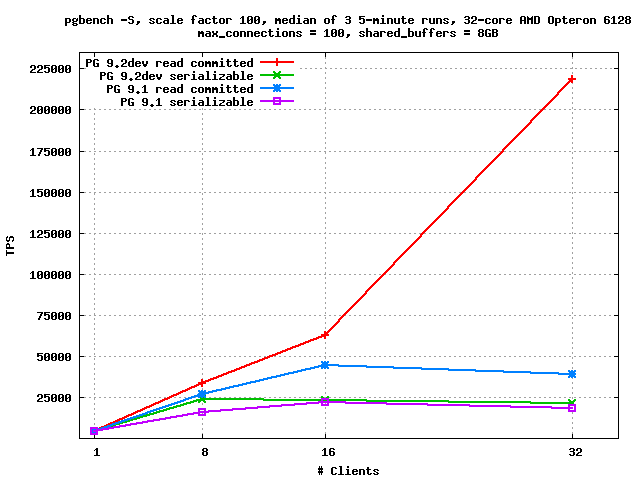
On Mon, Oct 10, 2011 at 3:59 PM, Kevin Grittner
<Kevin.Grittner@wicourts.gov> wrote:
> I do have some concern about whether the performance improvements
> from reduced LW locking contention elsewhere in the code may (in
> whack-a-mole fashion) cause the percentages to go higher in SSI.
> The biggest performance issues in some of the SSI benchmarks were on
> LW lock contention, so those may become more noticeable as other
> contention is reduced.  I've been trying to follow along on the
> threads regarding Robert's work in that area, with hopes of applying
> some of the same techniques to SSI, but it's not clear whether I'll
> have time to work on that for the 9.2 release.  (It's actually
> looking improbably at this point.)

I ran my good old pgbench -S, scale factor 100, shared_buffers = 8GB
test on Nate Boley's box.  I ran it on both 9.1 and 9.2dev, and at all
three isolation levels.  As usual, I took the median of three 5-minute
runs, which I've generally found adequate to eliminate the noise.  On
both 9.1 and 9.2dev, read committed and repeatable read have basically
identical performance; if anything, repeatable read may be slightly
better - which would make sense, if it cuts down the number of
snapshots taken.

Serializable mode is much slower on this test, though.  On
REL9_1_STABLE, it's about 8% slower with a single client.  At 8
clients, the difference rises to 43%, and at 32 clients, it's 51%
slower.  On 9.2devel, raw performance is somewhat higher (e.g. +51% at
8 clients) but the performance when not using SSI has improved so much
that the performance gap between serializable and the other two
isolation levels is now huge: with 32 clients, in serializable mode,
the median result was 21114.577645 tps; in read committed,
218748.929692 tps - that is, read committed is running more than ten
times faster than serializable.  Data are attached, in text form and
as a plot.  I excluded the repeatable read results from the plot as
they just clutter it up - they're basically on top of the read
committed results.

I haven't run this with LWLOCK_STATS, but my seat-of-the-pants guess
is that there's a single lightweight lock that everything is
bottlenecking on.  One possible difference between this test case and
the ones you may have used is that this case involves lots and lots of
really short transactions that don't do much.  The effect of anything
that only happens once or a few times per transaction is really
magnified in this type of workload (which is why the locking changes
make so much of a difference here - in a longer or heavier-weight
transaction that stuff would be lost in the noise).

--
Robert Haas
EnterpriseDB: http://www.enterprisedb.com
The Enterprise PostgreSQL Company
Вложения
В списке pgsql-hackers по дате отправления: