Re: Performance bottleneck. High active sessions but postmaster kernel threads are in a sleep state, low CPU utilization
| От | Hotmail |
|---|---|
| Тема | Re: Performance bottleneck. High active sessions but postmaster kernel threads are in a sleep state, low CPU utilization |
| Дата | |
| Msg-id | BYAPR06MB4023DF70385EC0C8E3E50C63D77C9@BYAPR06MB4023.namprd06.prod.outlook.com обсуждение исходный текст |
| Ответ на | Re: Performance bottleneck. High active sessions but postmaster kernel threads are in a sleep state, low CPU utilization (Hotmail <crajac66@hotmail.com>) |
| Ответы |
Re: Performance bottleneck. High active sessions but postmaster kernel threads are in a sleep state, low CPU utilization
|
| Список | pgsql-admin |
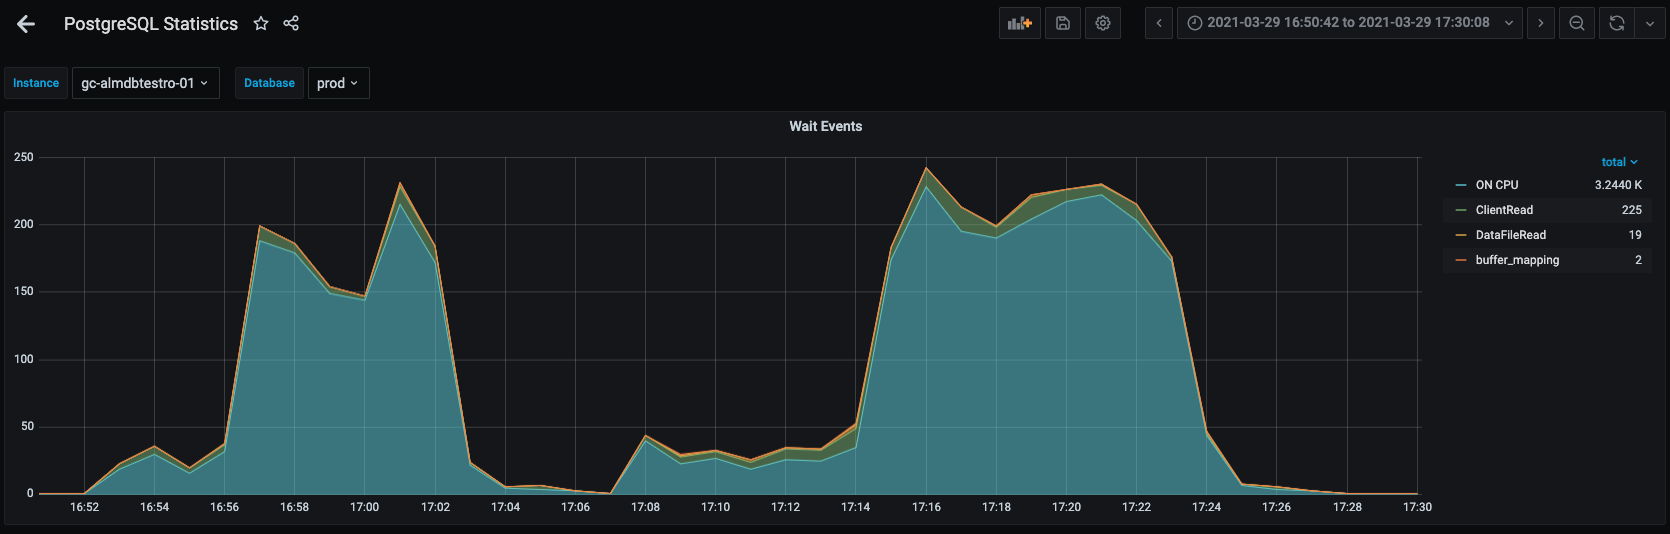
We actually keep track of the wait events in another grafana graph. We use the following query to generate the graph. (We assume that an active session that has a NULL wait_event is "ON CPU”. Not sure if our assuming an active session with a null wait being on cpu is valid. We sample pg_stat_activity every 30 seconds.
SELECT
coalesce(wait_event, 'ON CPU') AS type,
count(*)
FROM
pg_stat_activity
WHERE
state = 'active'
AND usename != 'repmgr'
GROUP BY
TYPE
ORDER BY
count(*) DESC ";
Here’s a sample from our wait_event graph during times when we see high active sessions but a sleeping postgres OS process. Is it possible we could be hitting an un-instremented wait event?
Craig
On Mar 31, 2021, 10:00 AM -0600, Hotmail <crajac66@hotmail.com>, wrote:
Unfortunately, the wait_event and wait_event_type columns are all NULL for these active sessions.CraigOn Mar 31, 2021, 3:47 AM -0600, Laurenz Albe <laurenz.albe@cybertec.at>, wrote:On Tue, 2021-03-30 at 12:22 -0600, Hotmail wrote:We are trying to gain some insight into a performance bottleneck that we are hitting while load testing Postgres on 11.11.
[hundreds of active sessions, but CPU is not maxed out]
With that many active sessions you are probably hitting some contention inside
the database. Look at "wait_event" and "wait_event_type" in pg_stat_activity.
Yours,
Laurenz Albe
--
Cybertec | https://www.cybertec-postgresql.com
Вложения
В списке pgsql-admin по дате отправления: