Re: Cache Hit Ratio%
| От | Fabio Pardi |
|---|---|
| Тема | Re: Cache Hit Ratio% |
| Дата | |
| Msg-id | 8c86a498-dd7a-8c06-b5d6-097cc1ec53c2@portavita.eu обсуждение исходный текст |
| Ответ на | RE: Cache Hit Ratio% (<soumik.bhattacharjee@kpn.com>) |
| Ответы |
RE: Cache Hit Ratio%
|
| Список | pgsql-admin |
If I were you, I would investigate the matter more in depth, and educate yourself on the subject.
You can get insights using pg_buffercache:
https://www.postgresql.org/docs/current/pgbuffercache.html
When in need, I also use the following query to understand how the buffers are rotating.
select usagecount,count(*),isdirty
from pg_buffercache
group by isdirty,usagecount
order by isdirty,usagecount ;
hope it helps.
regards,
fabio pardi
Hi,
This are the values for
- effective_cache_size = 6GB
- OS RAM = 25GB
Thanks..
From: Bhattacharjee, Soumik
Sent: dinsdag 28 juli 2020 10:36
To: Fabio Pardi <f.pardi@portavita.eu>; pgsql-admin@lists.postgresql.org
Subject: RE: Cache Hit Ratio%
Hi Fabio,
Its same across all env's
- Shared_buffers is 2GB
- DB size is same 12GB
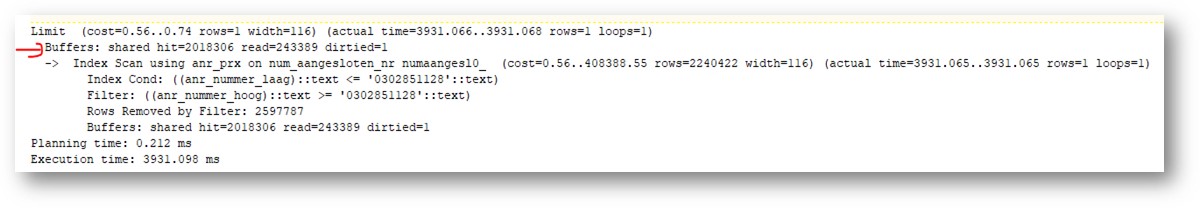
Query Plan in PROD Env
From: Fabio Pardi <f.pardi@portavita.eu>
Sent: dinsdag 28 juli 2020 10:13
To: pgsql-admin@lists.postgresql.org
Subject: Re: Cache Hit Ratio%
Hi,
I would start checking (and comparing with pre-prod) the db size, the shared_buffers size, how much data end up in cache and how are the cache layer's used.
regards,
fabio pardiOn 28/07/2020 10:04, soumik.bhattacharjee@kpn.com wrote:
Dear Experts,
We have done production migration from Oracle to PostgreSQL.
Could you please help me to know where to look out for - the Cache Hit Ratio is always at 65.72% , but in lower Pre-Prod env it’s kind of 95%.
As such no major slowness is reported by the customer so far.
Thanks
Вложения
В списке pgsql-admin по дате отправления: